29
/
en
AIzaSyAYiBZKx7MnpbEhh9jyipgxe19OcubqV5w
April 1, 2024
266652
Trinidad and Tobago
TTO
true
2
1
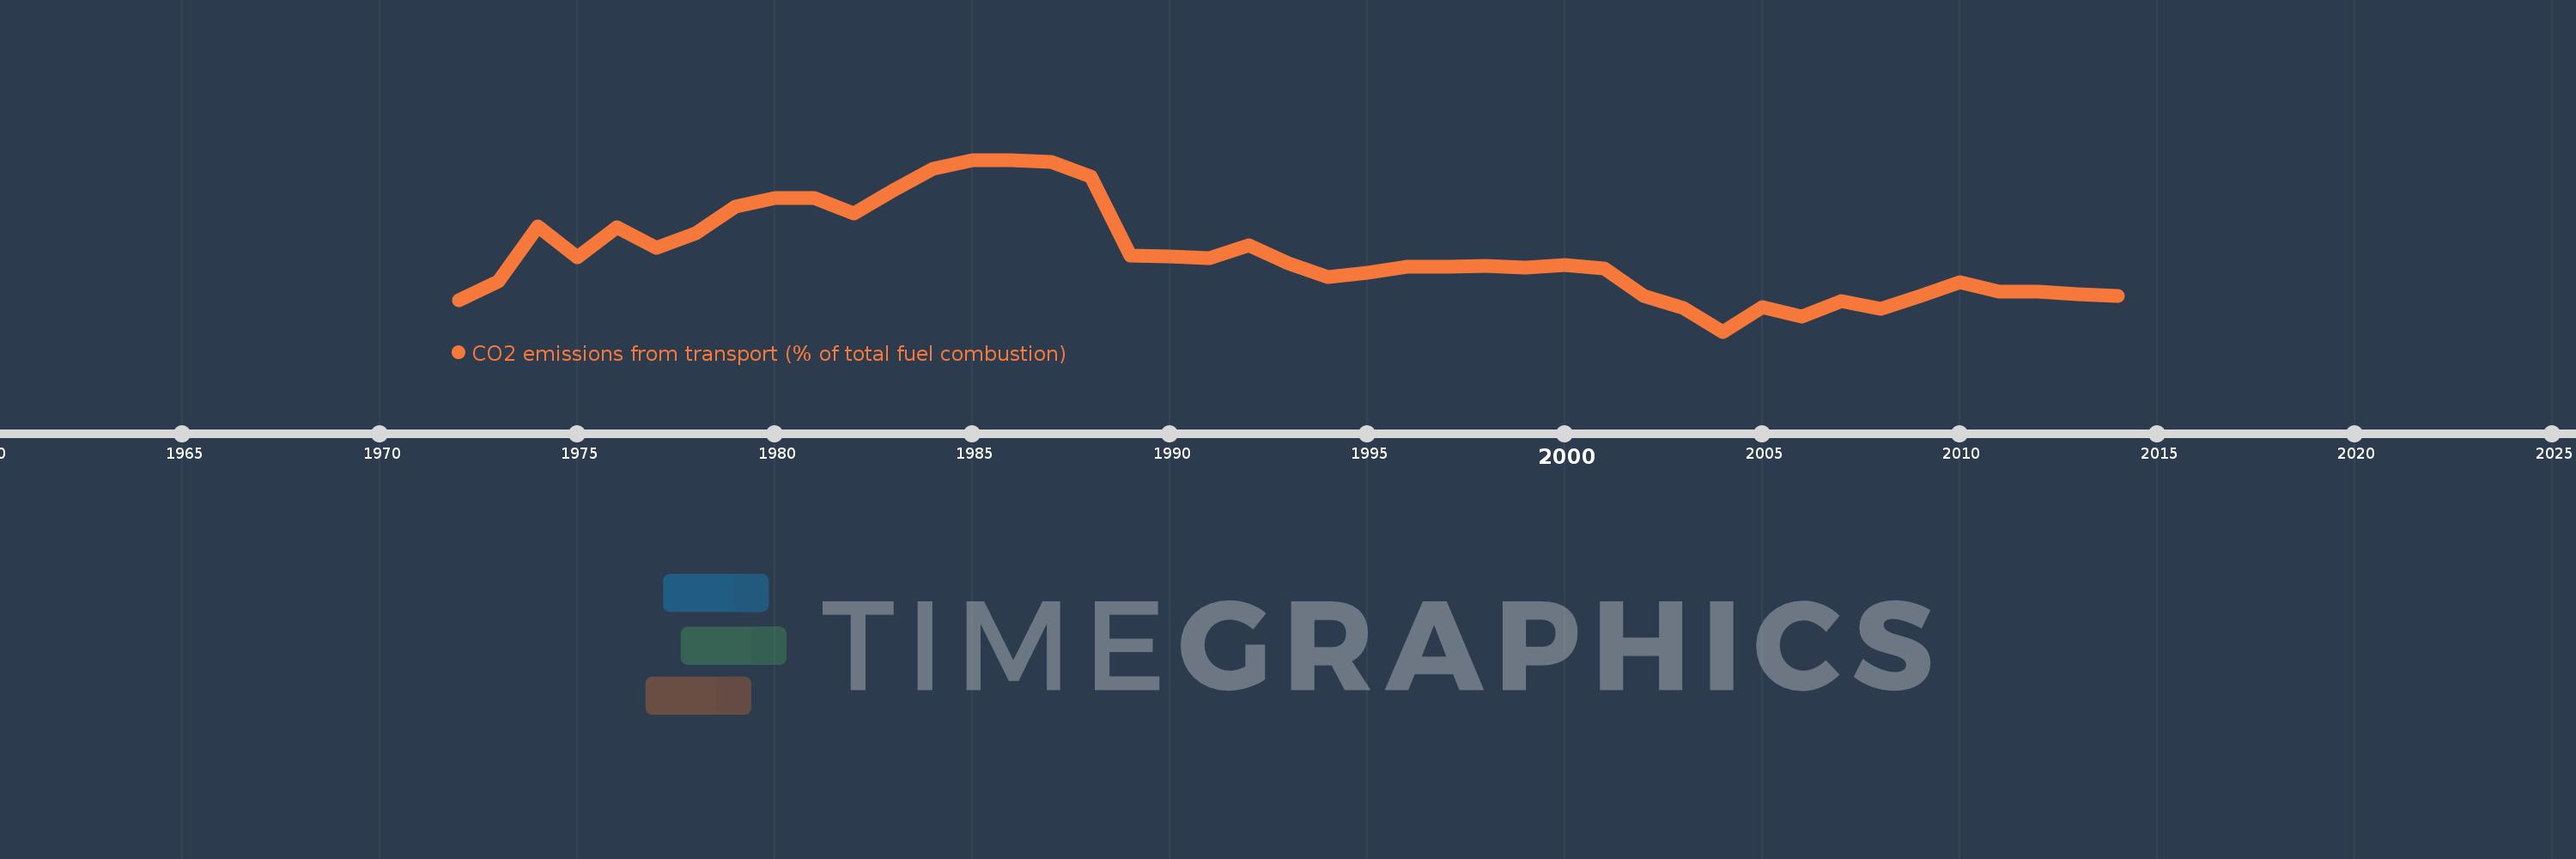
CO2 emissions from transport (% of total fuel combustion)
2014,2013,2012,2011,2010,2009,2008,2007,2006,2005,2004,2003,2002,2001,2000,1999,1998,1997,1996,1995,1994,1993,1992,1991,1990,1989,1988,1987,1986,1985,1984,1983,1982,1981,1980,1979,1978,1977,1976,1975,1974,1973,1972
This statistics in other country:
AlbaniaAlgeriaAngolaArab WorldArgentinaArmeniaAustraliaAustriaAzerbaijanBahrainBangladeshBelarusBelgiumBeninBoliviaBosnia and HerzegovinaBotswanaBrazilBrunei DarussalamBulgariaCambodiaCameroonCanadaCaribbean small statesCentral Europe and the BalticsChileChinaColombiaCongo, Dem. Rep.Congo, Rep.Costa RicaCote d'IvoireCroatiaCubaCuracaoCyprusCzech RepublicDenmarkDominican RepublicEarly-demographic dividendEast Asia & PacificEast Asia & Pacific (excluding high income)East Asia & Pacific (IDA & IBRD countries)EcuadorEgypt, Arab Rep.El SalvadorEritreaEstoniaEthiopiaEuro areaEurope & Central AsiaEurope & Central Asia (excluding high income)Europe & Central Asia (IDA & IBRD countries)European UnionFinlandFragile and conflict affected situationsFranceGabonGeorgiaGermanyGhanaGibraltarGreeceGuatemalaHaitiHeavily indebted poor countries (HIPC)High incomeHondurasHong Kong SAR, ChinaHungaryIBRD onlyIcelandIDA & IBRD totalIDA blendIDA onlyIDA totalIndiaIndonesiaIran, Islamic Rep.IraqIrelandIsraelItalyJamaicaJapanJordanKazakhstanKenyaKorea, Dem. People’s Rep.Korea, Rep.KosovoKuwaitKyrgyz RepublicLate-demographic dividendLatin America & Caribbean Latin America & Caribbean (excluding high income)Latin America & the Caribbean (IDA & IBRD countries)LatviaLeast developed countries: UN classificationLebanonLibyaLithuaniaLow & middle incomeLow incomeLower middle incomeLuxembourgMacedonia, FYRMalaysiaMaltaMauritiusMexicoMiddle East & North AfricaMiddle East & North Africa (excluding high income)Middle East & North Africa (IDA & IBRD countries)Middle incomeMoldovaMongoliaMontenegroMoroccoMozambiqueMyanmarNamibiaNepalNetherlandsNew ZealandNicaraguaNigerNigeriaNorth AmericaNorwayOECD membersOmanOther small statesPakistanPanamaParaguayPeruPhilippinesPolandPortugalPost-demographic dividendPre-demographic dividendQatarRomaniaRussian FederationSaudi ArabiaSenegalSerbiaSingaporeSlovak RepublicSloveniaSmall statesSouth AfricaSouth AsiaSouth Asia (IDA & IBRD)South SudanSpainSri LankaSub-Saharan Africa Sub-Saharan Africa (excluding high income)Sub-Saharan Africa (IDA & IBRD countries)SudanSwedenSwitzerlandSyrian Arab RepublicTajikistanTanzaniaThailandTogoTrinidad and TobagoTunisiaTurkeyTurkmenistanUkraineUnited Arab EmiratesUnited KingdomUnited StatesUpper middle incomeUruguayUzbekistanVenezuela, RBVietnamWorldYemen, Rep.ZambiaZimbabwe Timeline:
This timeline shows a graph from 1972 to 2014 of Trinidad and Tobago. No data until 1971. Number of actual observations by date: 43.
Source name:
World Development Indicators
Source organization:
IEA Statistics © OECD/IEA 2014 (http://www.iea.org/stats/index.asp), subject to https://www.iea.org/t&c/termsandconditions/
Categories, topics:
Environment
Last updated:
apr 23, 2017
Indicators value changes by year
Minimum:
10.973
jan 1, 2004
Maximum:
25.333
jan 1, 1985
At the date of observation
Value
Absolute change
Change from previous value
jan 1, 1972
13.594
+13.594
0.0%
jan 1, 1973
15.174
+1.58
11.62%
jan 1, 1974
19.753
+4.579
30.18%
jan 1, 1975
17.148
-2.605
-13.19%
jan 1, 1976
19.694
+2.545
14.84%
jan 1, 1977
17.954
-1.74
-8.84%
jan 1, 1978
19.192
+1.238
6.9%
jan 1, 1979
21.429
+2.237
11.65%
jan 1, 1980
22.128
+0.7
3.27%
jan 1, 1981
22.135
+0.007
0.03%
jan 1, 1982
20.833
-1.302
-5.88%
jan 1, 1983
22.792
+1.959
9.4%
jan 1, 1984
24.548
+1.756
7.71%
jan 1, 1985
25.333
+0.785
3.2%
jan 1, 1986
25.263
-0.07
-0.28%
jan 1, 1987
25.183
-0.08
-0.32%
jan 1, 1988
23.955
-1.228
-4.87%
jan 1, 1989
17.358
-6.598
-27.54%
jan 1, 1990
17.26
-0.098
-0.56%
jan 1, 1991
17.089
-0.171
-0.99%
jan 1, 1992
18.182
+1.093
6.4%
jan 1, 1993
16.646
-1.536
-8.45%
jan 1, 1994
15.502
-1.144
-6.87%
jan 1, 1995
15.881
+0.379
2.44%
jan 1, 1996
16.422
+0.541
3.4%
jan 1, 1997
16.372
-0.049
-0.3%
jan 1, 1998
16.465
+0.093
0.57%
jan 1, 1999
16.35
-0.115
-0.7%
jan 1, 2000
16.561
+0.211
1.29%
jan 1, 2001
16.238
-0.324
-1.95%
jan 1, 2002
13.934
-2.304
-14.19%
jan 1, 2003
12.94
-0.993
-7.13%
jan 1, 2004
10.973
-1.967
-15.2%
jan 1, 2005
13.016
+2.043
18.61%
jan 1, 2006
12.258
-0.758
-5.83%
jan 1, 2007
13.529
+1.271
10.37%
jan 1, 2008
12.841
-0.688
-5.09%
jan 1, 2009
13.934
+1.093
8.52%
jan 1, 2010
15.072
+1.138
8.17%
jan 1, 2011
14.324
-0.748
-4.96%
jan 1, 2012
14.344
+0.019
0.14%
jan 1, 2013
14.111
-0.233
-1.62%
jan 1, 2014
13.987
-0.124
-0.88%
Ranking of countries by current statistics by years


Comments: