29
/
en
AIzaSyAYiBZKx7MnpbEhh9jyipgxe19OcubqV5w
April 1, 2024
65772
Algeria
DZA
true
2
1
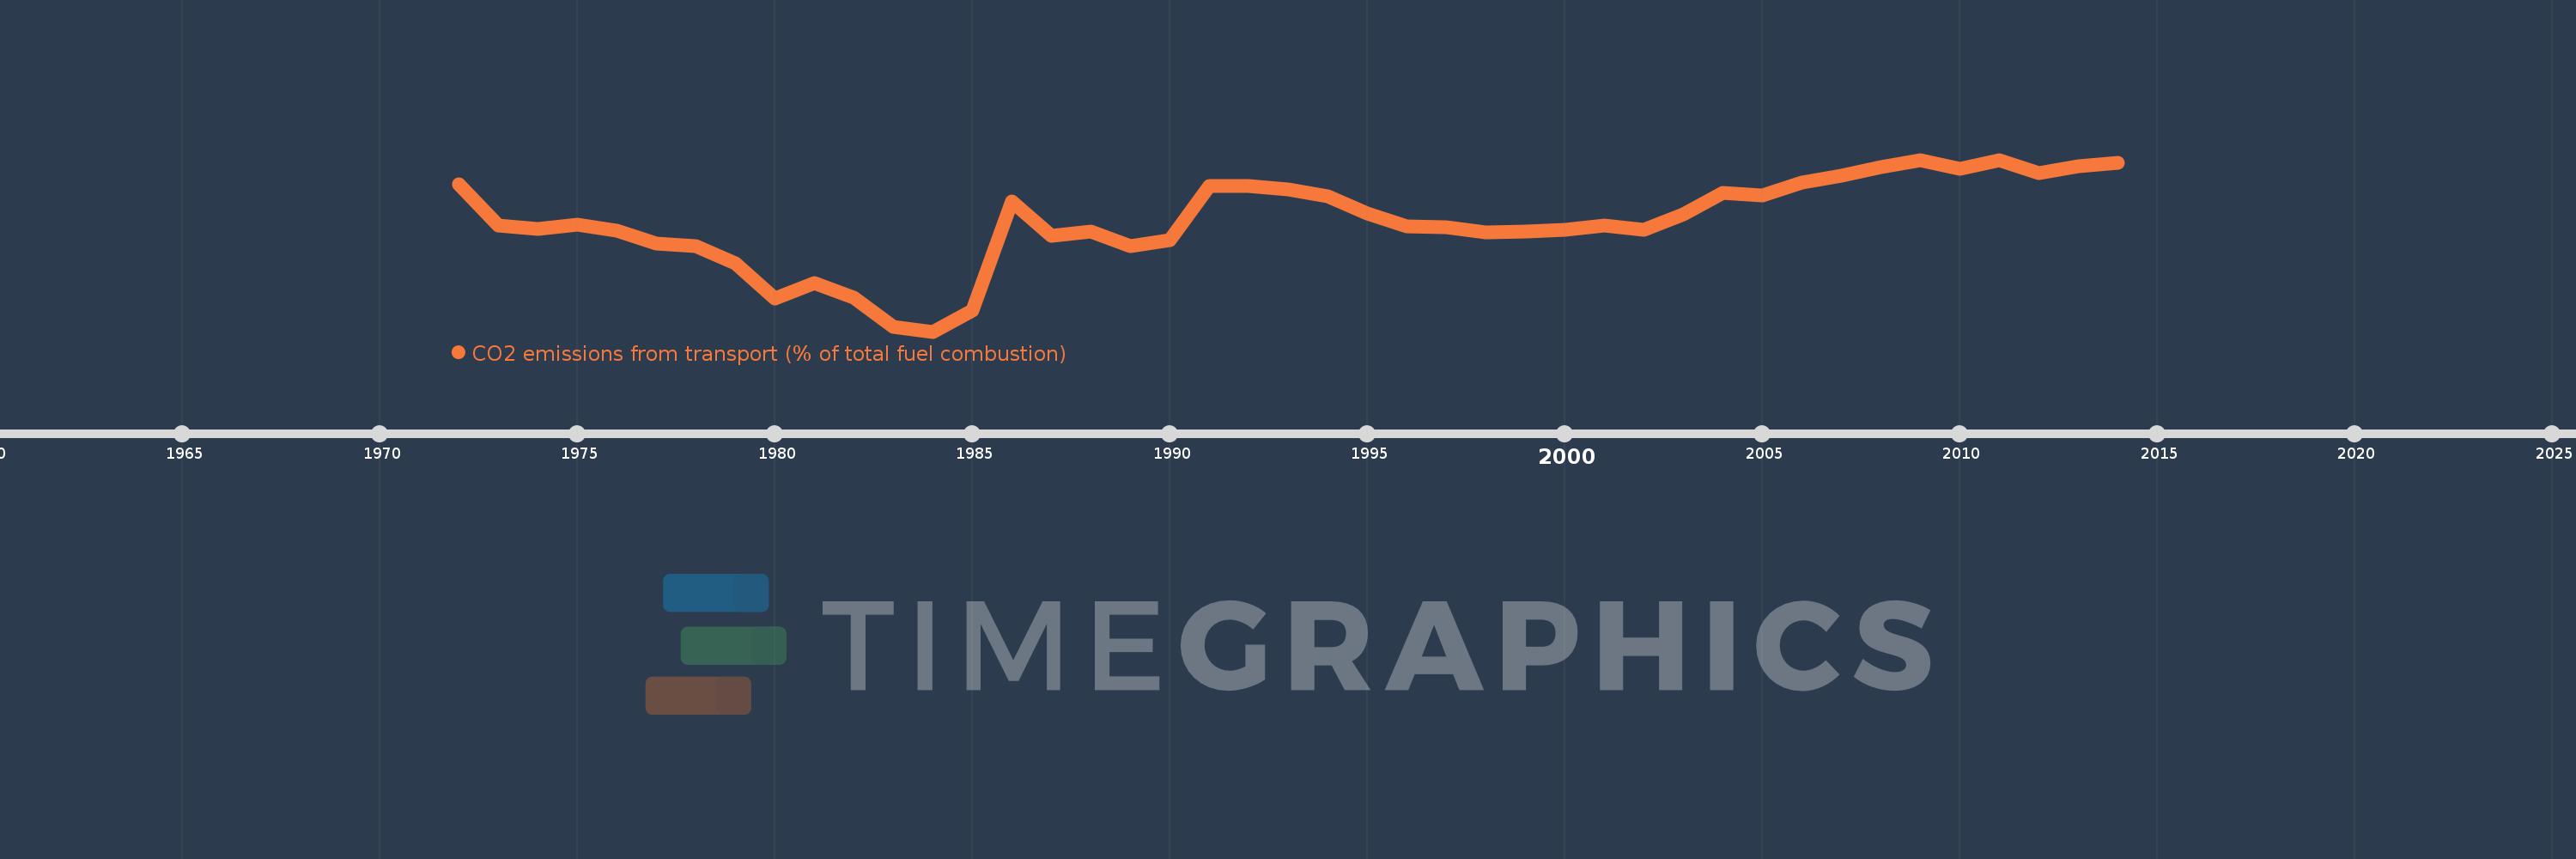
CO2 emissions from transport (% of total fuel combustion)
2014,2013,2012,2011,2010,2009,2008,2007,2006,2005,2004,2003,2002,2001,2000,1999,1998,1997,1996,1995,1994,1993,1992,1991,1990,1989,1988,1987,1986,1985,1984,1983,1982,1981,1980,1979,1978,1977,1976,1975,1974,1973,1972
This statistics in other country:
AlbaniaAlgeriaAngolaArab WorldArgentinaArmeniaAustraliaAustriaAzerbaijanBahrainBangladeshBelarusBelgiumBeninBoliviaBosnia and HerzegovinaBotswanaBrazilBrunei DarussalamBulgariaCambodiaCameroonCanadaCaribbean small statesCentral Europe and the BalticsChileChinaColombiaCongo, Dem. Rep.Congo, Rep.Costa RicaCote d'IvoireCroatiaCubaCuracaoCyprusCzech RepublicDenmarkDominican RepublicEarly-demographic dividendEast Asia & PacificEast Asia & Pacific (excluding high income)East Asia & Pacific (IDA & IBRD countries)EcuadorEgypt, Arab Rep.El SalvadorEritreaEstoniaEthiopiaEuro areaEurope & Central AsiaEurope & Central Asia (excluding high income)Europe & Central Asia (IDA & IBRD countries)European UnionFinlandFragile and conflict affected situationsFranceGabonGeorgiaGermanyGhanaGibraltarGreeceGuatemalaHaitiHeavily indebted poor countries (HIPC)High incomeHondurasHong Kong SAR, ChinaHungaryIBRD onlyIcelandIDA & IBRD totalIDA blendIDA onlyIDA totalIndiaIndonesiaIran, Islamic Rep.IraqIrelandIsraelItalyJamaicaJapanJordanKazakhstanKenyaKorea, Dem. People’s Rep.Korea, Rep.KosovoKuwaitKyrgyz RepublicLate-demographic dividendLatin America & Caribbean Latin America & Caribbean (excluding high income)Latin America & the Caribbean (IDA & IBRD countries)LatviaLeast developed countries: UN classificationLebanonLibyaLithuaniaLow & middle incomeLow incomeLower middle incomeLuxembourgMacedonia, FYRMalaysiaMaltaMauritiusMexicoMiddle East & North AfricaMiddle East & North Africa (excluding high income)Middle East & North Africa (IDA & IBRD countries)Middle incomeMoldovaMongoliaMontenegroMoroccoMozambiqueMyanmarNamibiaNepalNetherlandsNew ZealandNicaraguaNigerNigeriaNorth AmericaNorwayOECD membersOmanOther small statesPakistanPanamaParaguayPeruPhilippinesPolandPortugalPost-demographic dividendPre-demographic dividendQatarRomaniaRussian FederationSaudi ArabiaSenegalSerbiaSingaporeSlovak RepublicSloveniaSmall statesSouth AfricaSouth AsiaSouth Asia (IDA & IBRD)South SudanSpainSri LankaSub-Saharan Africa Sub-Saharan Africa (excluding high income)Sub-Saharan Africa (IDA & IBRD countries)SudanSwedenSwitzerlandSyrian Arab RepublicTajikistanTanzaniaThailandTogoTrinidad and TobagoTunisiaTurkeyTurkmenistanUkraineUnited Arab EmiratesUnited KingdomUnited StatesUpper middle incomeUruguayUzbekistanVenezuela, RBVietnamWorldYemen, Rep.ZambiaZimbabwe Timeline:
This timeline shows a graph from 1972 to 2014 of Algeria. No data until 1971. Number of actual observations by date: 43.
Source name:
World Development Indicators
Source organization:
IEA Statistics © OECD/IEA 2014 (http://www.iea.org/stats/index.asp), subject to https://www.iea.org/t&c/termsandconditions/
Categories, topics:
Environment
Last updated:
apr 23, 2017
Indicators value changes by year
Minimum:
18.173
jan 1, 1984
Maximum:
33.133
jan 1, 2009
At the date of observation
Value
Absolute change
Change from previous value
jan 1, 1972
30.966
+30.966
0.0%
jan 1, 1973
27.386
-3.58
-11.56%
jan 1, 1974
27.116
-0.27
-0.99%
jan 1, 1975
27.471
+0.355
1.31%
jan 1, 1976
26.937
-0.533
-1.94%
jan 1, 1977
25.847
-1.09
-4.05%
jan 1, 1978
25.621
-0.226
-0.87%
jan 1, 1979
24.117
-1.504
-5.87%
jan 1, 1980
21.023
-3.094
-12.83%
jan 1, 1981
22.395
+1.371
6.52%
jan 1, 1982
21.115
-1.28
-5.71%
jan 1, 1983
18.577
-2.538
-12.02%
jan 1, 1984
18.173
-0.404
-2.17%
jan 1, 1985
20.0
+1.827
10.05%
jan 1, 1986
29.505
+9.505
47.53%
jan 1, 1987
26.502
-3.004
-10.18%
jan 1, 1988
26.868
+0.366
1.38%
jan 1, 1989
25.641
-1.227
-4.57%
jan 1, 1990
26.105
+0.464
1.81%
jan 1, 1991
30.884
+4.778
18.3%
jan 1, 1992
30.854
-0.03
-0.1%
jan 1, 1993
30.579
-0.275
-0.89%
jan 1, 1994
29.922
-0.656
-2.15%
jan 1, 1995
28.425
-1.497
-5.0%
jan 1, 1996
27.314
-1.111
-3.91%
jan 1, 1997
27.259
-0.054
-0.2%
jan 1, 1998
26.813
-0.446
-1.64%
jan 1, 1999
26.882
+0.069
0.26%
jan 1, 2000
27.04
+0.158
0.59%
jan 1, 2001
27.387
+0.347
1.28%
jan 1, 2002
27.048
-0.339
-1.24%
jan 1, 2003
28.402
+1.354
5.01%
jan 1, 2004
30.225
+1.824
6.42%
jan 1, 2005
30.02
-0.205
-0.68%
jan 1, 2006
31.181
+1.161
3.87%
jan 1, 2007
31.735
+0.554
1.78%
jan 1, 2008
32.516
+0.781
2.46%
jan 1, 2009
33.133
+0.617
1.9%
jan 1, 2010
32.316
-0.816
-2.46%
jan 1, 2011
33.1
+0.784
2.42%
jan 1, 2012
31.966
-1.135
-3.43%
jan 1, 2013
32.556
+0.591
1.85%
jan 1, 2014
32.836
+0.279
0.86%
Ranking of countries by current statistics by years


Comments: