29
/
en
AIzaSyAYiBZKx7MnpbEhh9jyipgxe19OcubqV5w
April 1, 2024
34819
Heavily indebted poor countries (HIPC)
HPC
false
2
1
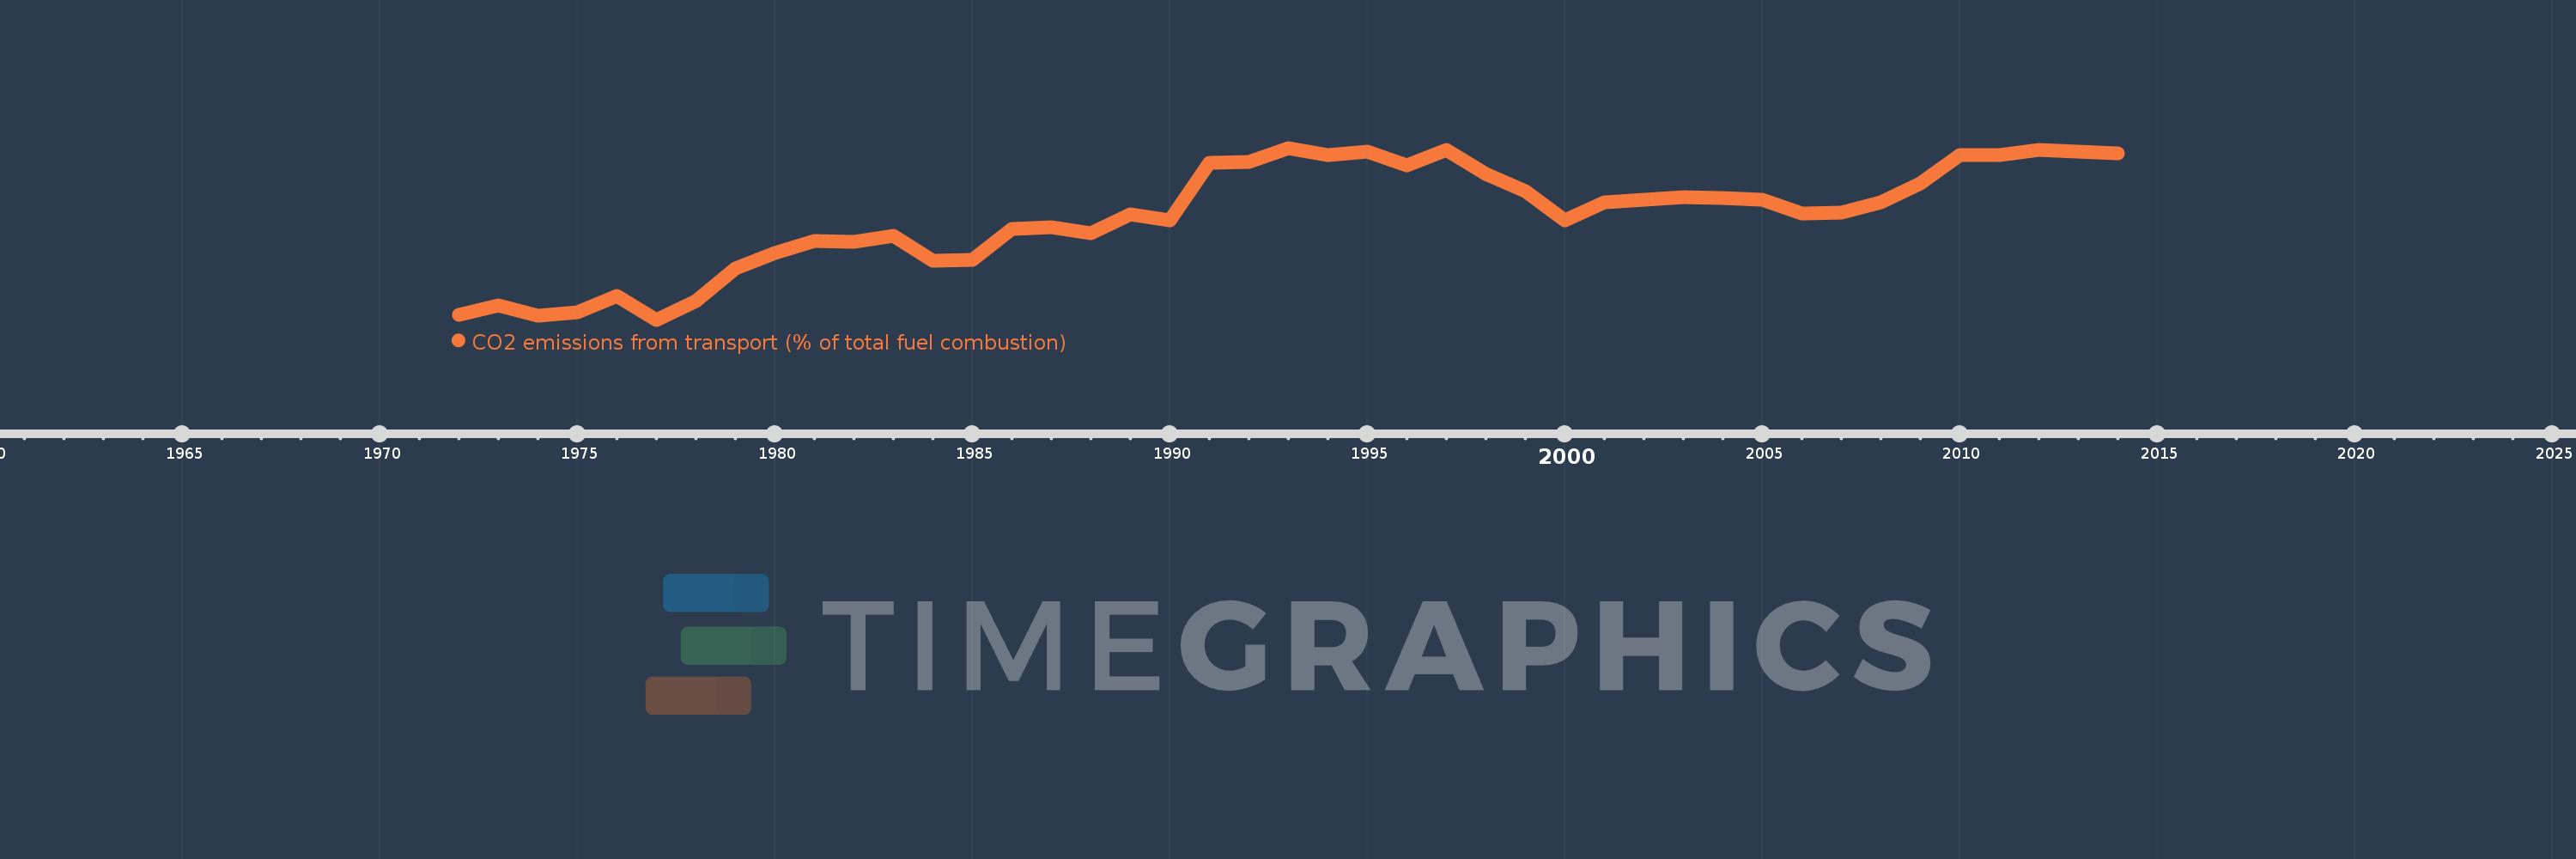
CO2 emissions from transport (% of total fuel combustion)
2014,2013,2012,2011,2010,2009,2008,2007,2006,2005,2004,2003,2002,2001,2000,1999,1998,1997,1996,1995,1994,1993,1992,1991,1990,1989,1988,1987,1986,1985,1984,1983,1982,1981,1980,1979,1978,1977,1976,1975,1974,1973,1972
This statistics in other country:
AlbaniaAlgeriaAngolaArab WorldArgentinaArmeniaAustraliaAustriaAzerbaijanBahrainBangladeshBelarusBelgiumBeninBoliviaBosnia and HerzegovinaBotswanaBrazilBrunei DarussalamBulgariaCambodiaCameroonCanadaCaribbean small statesCentral Europe and the BalticsChileChinaColombiaCongo, Dem. Rep.Congo, Rep.Costa RicaCote d'IvoireCroatiaCubaCuracaoCyprusCzech RepublicDenmarkDominican RepublicEarly-demographic dividendEast Asia & PacificEast Asia & Pacific (excluding high income)East Asia & Pacific (IDA & IBRD countries)EcuadorEgypt, Arab Rep.El SalvadorEritreaEstoniaEthiopiaEuro areaEurope & Central AsiaEurope & Central Asia (excluding high income)Europe & Central Asia (IDA & IBRD countries)European UnionFinlandFragile and conflict affected situationsFranceGabonGeorgiaGermanyGhanaGibraltarGreeceGuatemalaHaitiHeavily indebted poor countries (HIPC)High incomeHondurasHong Kong SAR, ChinaHungaryIBRD onlyIcelandIDA & IBRD totalIDA blendIDA onlyIDA totalIndiaIndonesiaIran, Islamic Rep.IraqIrelandIsraelItalyJamaicaJapanJordanKazakhstanKenyaKorea, Dem. People’s Rep.Korea, Rep.KosovoKuwaitKyrgyz RepublicLate-demographic dividendLatin America & Caribbean Latin America & Caribbean (excluding high income)Latin America & the Caribbean (IDA & IBRD countries)LatviaLeast developed countries: UN classificationLebanonLibyaLithuaniaLow & middle incomeLow incomeLower middle incomeLuxembourgMacedonia, FYRMalaysiaMaltaMauritiusMexicoMiddle East & North AfricaMiddle East & North Africa (excluding high income)Middle East & North Africa (IDA & IBRD countries)Middle incomeMoldovaMongoliaMontenegroMoroccoMozambiqueMyanmarNamibiaNepalNetherlandsNew ZealandNicaraguaNigerNigeriaNorth AmericaNorwayOECD membersOmanOther small statesPakistanPanamaParaguayPeruPhilippinesPolandPortugalPost-demographic dividendPre-demographic dividendQatarRomaniaRussian FederationSaudi ArabiaSenegalSerbiaSingaporeSlovak RepublicSloveniaSmall statesSouth AfricaSouth AsiaSouth Asia (IDA & IBRD)South SudanSpainSri LankaSub-Saharan Africa Sub-Saharan Africa (excluding high income)Sub-Saharan Africa (IDA & IBRD countries)SudanSwedenSwitzerlandSyrian Arab RepublicTajikistanTanzaniaThailandTogoTrinidad and TobagoTunisiaTurkeyTurkmenistanUkraineUnited Arab EmiratesUnited KingdomUnited StatesUpper middle incomeUruguayUzbekistanVenezuela, RBVietnamWorldYemen, Rep.ZambiaZimbabwe Timeline:
This timeline shows a graph from 1972 to 2014 of Heavily indebted poor countries (HIPC). No data until 1971. Number of actual observations by date: 43.
Source name:
World Development Indicators
Source organization:
IEA Statistics © OECD/IEA 2014 (http://www.iea.org/stats/index.asp), subject to https://www.iea.org/t&c/termsandconditions/
Categories, topics:
Environment
Last updated:
apr 23, 2017
Indicators value changes by year
Minimum:
38.495
jan 1, 1977
Maximum:
50.185
jan 1, 1993
At the date of observation
Value
Absolute change
Change from previous value
jan 1, 1972
38.848
+38.848
0.0%
jan 1, 1973
39.494
+0.645
1.66%
jan 1, 1974
38.78
-0.714
-1.81%
jan 1, 1975
38.986
+0.206
0.53%
jan 1, 1976
40.128
+1.142
2.93%
jan 1, 1977
38.495
-1.633
-4.07%
jan 1, 1978
39.769
+1.274
3.31%
jan 1, 1979
41.98
+2.211
5.56%
jan 1, 1980
43.056
+1.076
2.56%
jan 1, 1981
43.863
+0.807
1.87%
jan 1, 1982
43.819
-0.043
-0.1%
jan 1, 1983
44.218
+0.399
0.91%
jan 1, 1984
42.523
-1.695
-3.83%
jan 1, 1985
42.576
+0.053
0.12%
jan 1, 1986
44.696
+2.12
4.98%
jan 1, 1987
44.781
+0.085
0.19%
jan 1, 1988
44.364
-0.418
-0.93%
jan 1, 1989
45.666
+1.303
2.94%
jan 1, 1990
45.25
-0.416
-0.91%
jan 1, 1991
49.183
+3.932
8.69%
jan 1, 1992
49.254
+0.071
0.14%
jan 1, 1993
50.185
+0.932
1.89%
jan 1, 1994
49.696
-0.489
-0.97%
jan 1, 1995
49.92
+0.223
0.45%
jan 1, 1996
48.993
-0.926
-1.86%
jan 1, 1997
50.035
+1.042
2.13%
jan 1, 1998
48.411
-1.624
-3.25%
jan 1, 1999
47.228
-1.183
-2.44%
jan 1, 2000
45.286
-1.942
-4.11%
jan 1, 2001
46.487
+1.201
2.65%
jan 1, 2002
46.644
+0.158
0.34%
jan 1, 2003
46.814
+0.17
0.36%
jan 1, 2004
46.772
-0.042
-0.09%
jan 1, 2005
46.654
-0.118
-0.25%
jan 1, 2006
45.728
-0.926
-1.98%
jan 1, 2007
45.786
+0.058
0.13%
jan 1, 2008
46.483
+0.698
1.52%
jan 1, 2009
47.796
+1.313
2.82%
jan 1, 2010
49.676
+1.88
3.93%
jan 1, 2011
49.705
+0.028
0.06%
jan 1, 2012
50.044
+0.339
0.68%
jan 1, 2013
49.911
-0.133
-0.27%
jan 1, 2014
49.823
-0.088
-0.18%
Ranking of countries by current statistics by years


Comments: