29
/
en
AIzaSyAYiBZKx7MnpbEhh9jyipgxe19OcubqV5w
April 1, 2024
198870
Mongolia
MNG
true
2
1
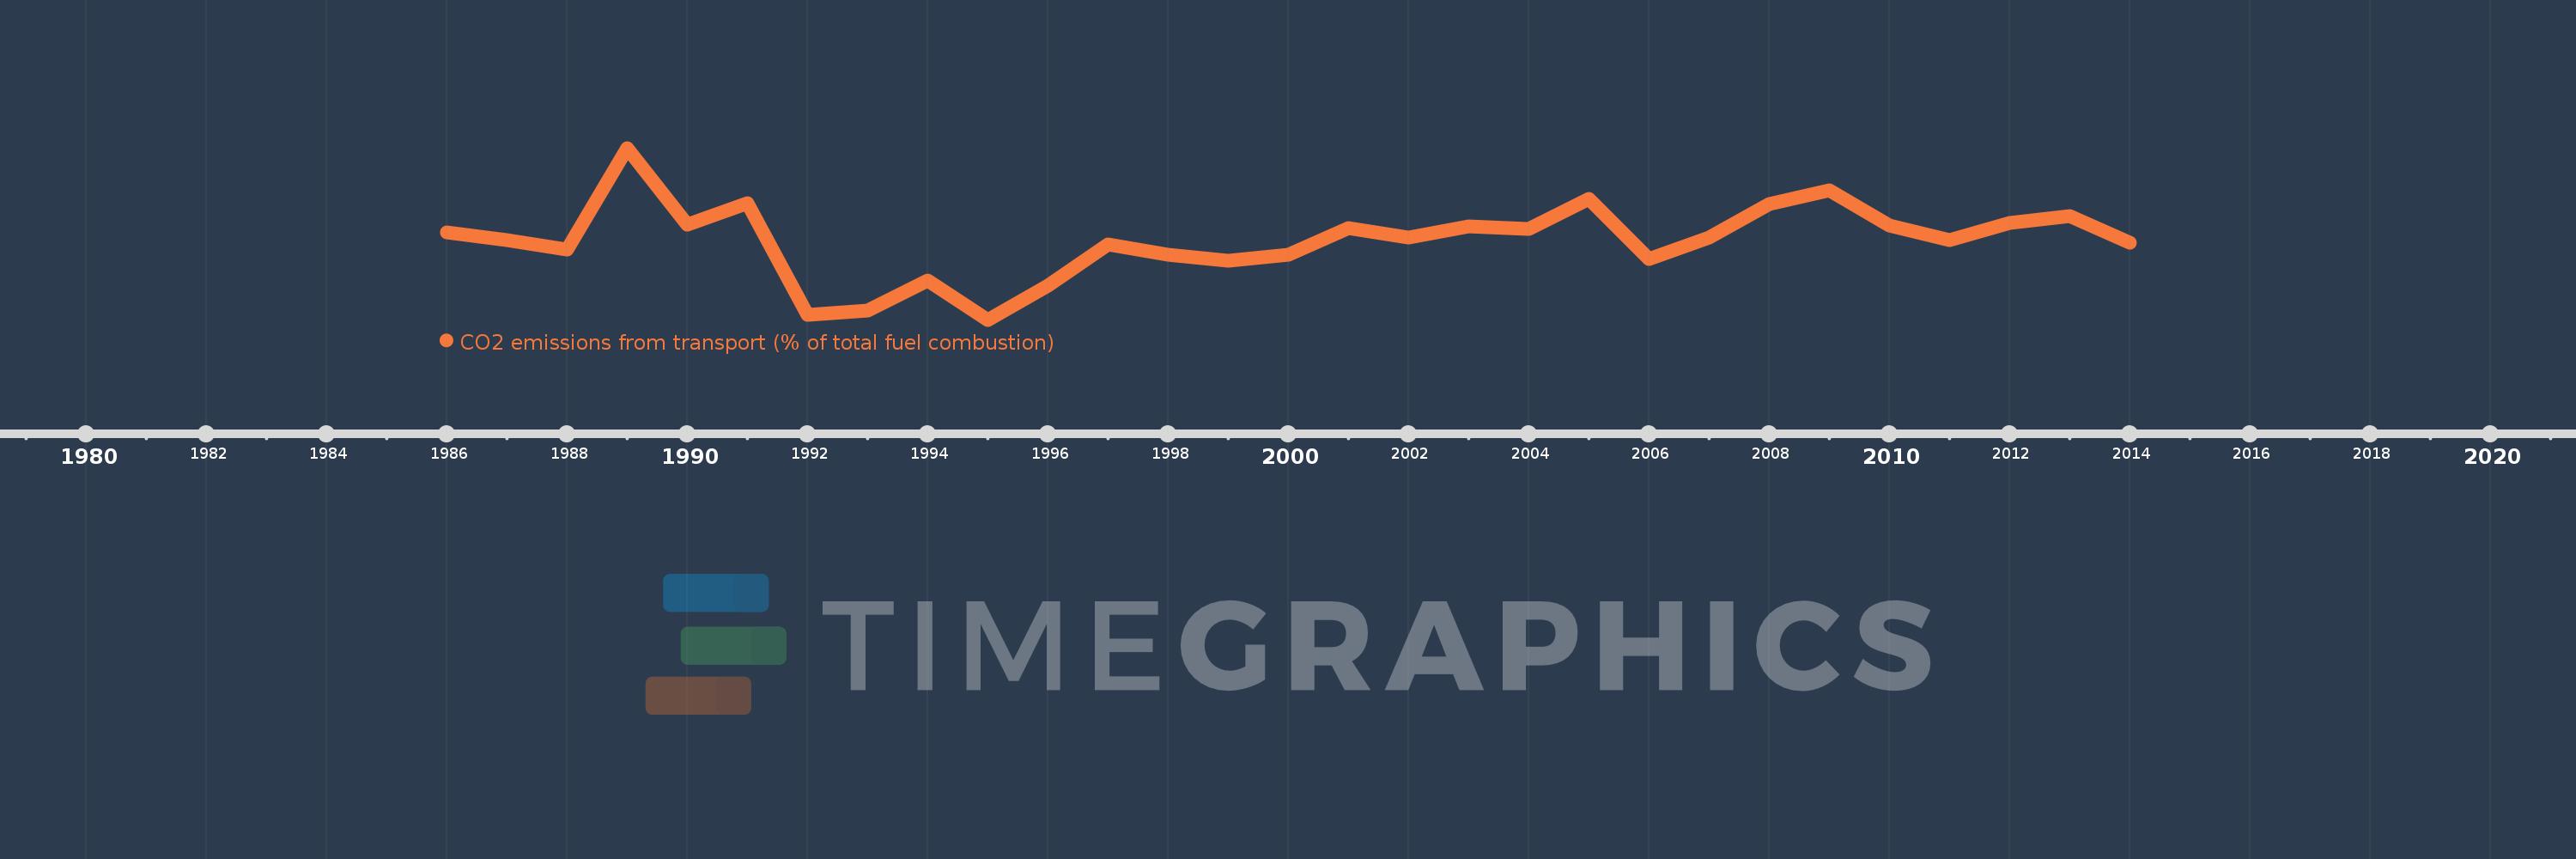
CO2 emissions from transport (% of total fuel combustion)
2014,2013,2012,2011,2010,2009,2008,2007,2006,2005,2004,2003,2002,2001,2000,1999,1998,1997,1996,1995,1994,1993,1992,1991,1990,1989,1988,1987,1986
This statistics in other country:
AlbaniaAlgeriaAngolaArab WorldArgentinaArmeniaAustraliaAustriaAzerbaijanBahrainBangladeshBelarusBelgiumBeninBoliviaBosnia and HerzegovinaBotswanaBrazilBrunei DarussalamBulgariaCambodiaCameroonCanadaCaribbean small statesCentral Europe and the BalticsChileChinaColombiaCongo, Dem. Rep.Congo, Rep.Costa RicaCote d'IvoireCroatiaCubaCuracaoCyprusCzech RepublicDenmarkDominican RepublicEarly-demographic dividendEast Asia & PacificEast Asia & Pacific (excluding high income)East Asia & Pacific (IDA & IBRD countries)EcuadorEgypt, Arab Rep.El SalvadorEritreaEstoniaEthiopiaEuro areaEurope & Central AsiaEurope & Central Asia (excluding high income)Europe & Central Asia (IDA & IBRD countries)European UnionFinlandFragile and conflict affected situationsFranceGabonGeorgiaGermanyGhanaGibraltarGreeceGuatemalaHaitiHeavily indebted poor countries (HIPC)High incomeHondurasHong Kong SAR, ChinaHungaryIBRD onlyIcelandIDA & IBRD totalIDA blendIDA onlyIDA totalIndiaIndonesiaIran, Islamic Rep.IraqIrelandIsraelItalyJamaicaJapanJordanKazakhstanKenyaKorea, Dem. People’s Rep.Korea, Rep.KosovoKuwaitKyrgyz RepublicLate-demographic dividendLatin America & Caribbean Latin America & Caribbean (excluding high income)Latin America & the Caribbean (IDA & IBRD countries)LatviaLeast developed countries: UN classificationLebanonLibyaLithuaniaLow & middle incomeLow incomeLower middle incomeLuxembourgMacedonia, FYRMalaysiaMaltaMauritiusMexicoMiddle East & North AfricaMiddle East & North Africa (excluding high income)Middle East & North Africa (IDA & IBRD countries)Middle incomeMoldovaMongoliaMontenegroMoroccoMozambiqueMyanmarNamibiaNepalNetherlandsNew ZealandNicaraguaNigerNigeriaNorth AmericaNorwayOECD membersOmanOther small statesPakistanPanamaParaguayPeruPhilippinesPolandPortugalPost-demographic dividendPre-demographic dividendQatarRomaniaRussian FederationSaudi ArabiaSenegalSerbiaSingaporeSlovak RepublicSloveniaSmall statesSouth AfricaSouth AsiaSouth Asia (IDA & IBRD)South SudanSpainSri LankaSub-Saharan Africa Sub-Saharan Africa (excluding high income)Sub-Saharan Africa (IDA & IBRD countries)SudanSwedenSwitzerlandSyrian Arab RepublicTajikistanTanzaniaThailandTogoTrinidad and TobagoTunisiaTurkeyTurkmenistanUkraineUnited Arab EmiratesUnited KingdomUnited StatesUpper middle incomeUruguayUzbekistanVenezuela, RBVietnamWorldYemen, Rep.ZambiaZimbabwe Timeline:
This timeline shows a graph from 1986 to 2014 of Mongolia. No data until 1985. Number of actual observations by date: 29.
Source name:
World Development Indicators
Source organization:
IEA Statistics © OECD/IEA 2014 (http://www.iea.org/stats/index.asp), subject to https://www.iea.org/t&c/termsandconditions/
Categories, topics:
Environment
Last updated:
apr 23, 2017
Indicators value changes by year
Maximum:
14.573
jan 1, 1989
At the date of observation
Value
Absolute change
Change from previous value
jan 1, 1986
10.611
+10.611
0.0%
jan 1, 1987
10.234
-0.377
-3.55%
jan 1, 1988
9.808
-0.426
-4.16%
jan 1, 1989
14.573
+4.765
48.58%
jan 1, 1990
10.965
-3.608
-24.76%
jan 1, 1991
11.975
+1.01
9.21%
jan 1, 1992
6.739
-5.236
-43.72%
jan 1, 1993
6.942
+0.203
3.01%
jan 1, 1994
8.361
+1.419
20.44%
jan 1, 1995
6.505
-1.857
-22.2%
jan 1, 1996
8.098
+1.593
24.48%
jan 1, 1997
10.035
+1.937
23.92%
jan 1, 1998
9.541
-0.494
-4.92%
jan 1, 1999
9.272
-0.268
-2.81%
jan 1, 2000
9.557
+0.285
3.07%
jan 1, 2001
10.802
+1.245
13.02%
jan 1, 2002
10.379
-0.422
-3.91%
jan 1, 2003
10.879
+0.499
4.81%
jan 1, 2004
10.787
-0.091
-0.84%
jan 1, 2005
12.185
+1.397
12.95%
jan 1, 2006
9.364
-2.821
-23.15%
jan 1, 2007
10.381
+1.018
10.87%
jan 1, 2008
11.92
+1.538
14.82%
jan 1, 2009
12.597
+0.678
5.69%
jan 1, 2010
10.923
-1.675
-13.29%
jan 1, 2011
10.247
-0.675
-6.18%
jan 1, 2012
11.033
+0.785
7.66%
jan 1, 2013
11.357
+0.324
2.94%
jan 1, 2014
10.129
-1.228
-10.82%
Ranking of countries by current statistics by years


Comments: