29
/
en
AIzaSyAYiBZKx7MnpbEhh9jyipgxe19OcubqV5w
April 1, 2024
33294
European Union
EUU
false
2
1
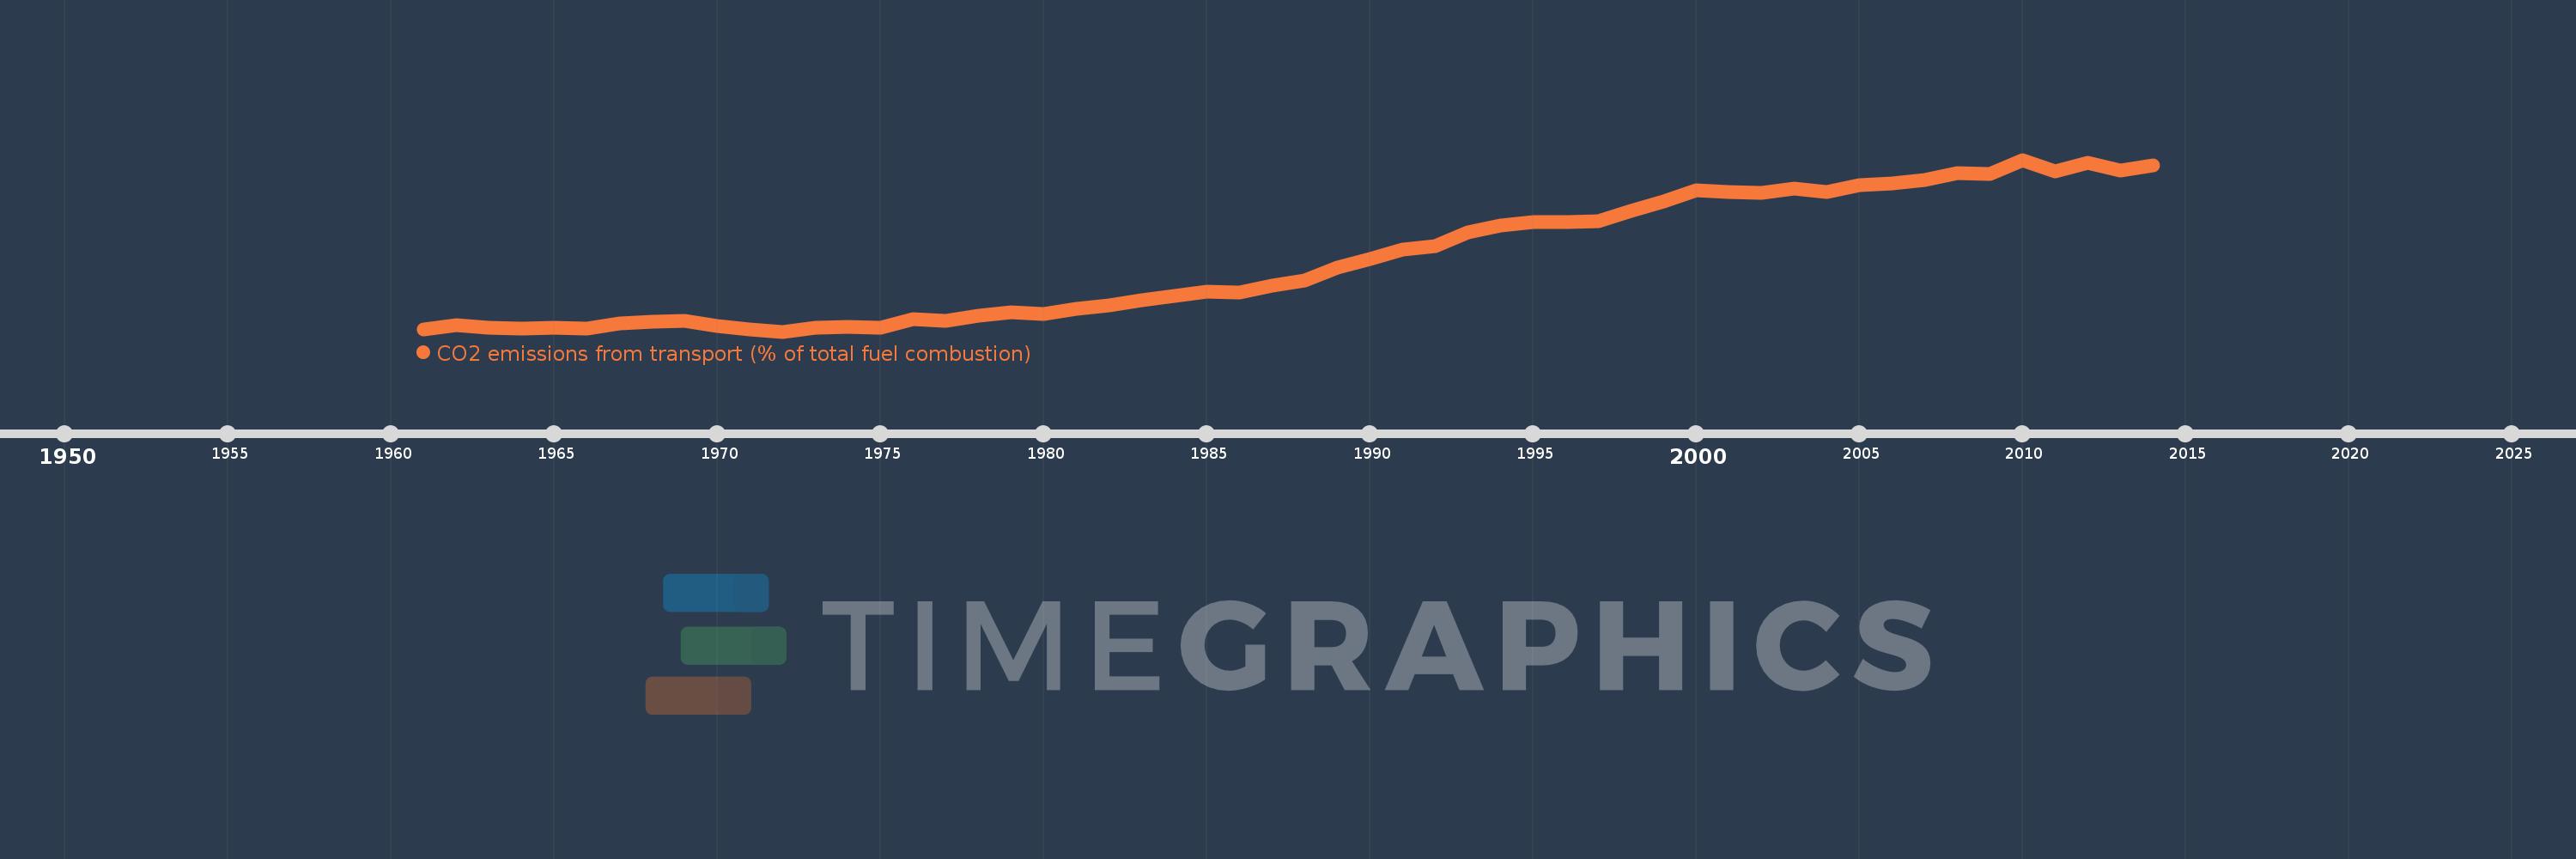
CO2 emissions from transport (% of total fuel combustion)
2014,2013,2012,2011,2010,2009,2008,2007,2006,2005,2004,2003,2002,2001,2000,1999,1998,1997,1996,1995,1994,1993,1992,1991,1990,1989,1988,1987,1986,1985,1984,1983,1982,1981,1980,1979,1978,1977,1976,1975,1974,1973,1972,1971,1970,1969,1968,1967,1966,1965,1964,1963,1962,1961
This statistics in other country:
AlbaniaAlgeriaAngolaArab WorldArgentinaArmeniaAustraliaAustriaAzerbaijanBahrainBangladeshBelarusBelgiumBeninBoliviaBosnia and HerzegovinaBotswanaBrazilBrunei DarussalamBulgariaCambodiaCameroonCanadaCaribbean small statesCentral Europe and the BalticsChileChinaColombiaCongo, Dem. Rep.Congo, Rep.Costa RicaCote d'IvoireCroatiaCubaCuracaoCyprusCzech RepublicDenmarkDominican RepublicEarly-demographic dividendEast Asia & PacificEast Asia & Pacific (excluding high income)East Asia & Pacific (IDA & IBRD countries)EcuadorEgypt, Arab Rep.El SalvadorEritreaEstoniaEthiopiaEuro areaEurope & Central AsiaEurope & Central Asia (excluding high income)Europe & Central Asia (IDA & IBRD countries)European UnionFinlandFragile and conflict affected situationsFranceGabonGeorgiaGermanyGhanaGibraltarGreeceGuatemalaHaitiHeavily indebted poor countries (HIPC)High incomeHondurasHong Kong SAR, ChinaHungaryIBRD onlyIcelandIDA & IBRD totalIDA blendIDA onlyIDA totalIndiaIndonesiaIran, Islamic Rep.IraqIrelandIsraelItalyJamaicaJapanJordanKazakhstanKenyaKorea, Dem. People’s Rep.Korea, Rep.KosovoKuwaitKyrgyz RepublicLate-demographic dividendLatin America & Caribbean Latin America & Caribbean (excluding high income)Latin America & the Caribbean (IDA & IBRD countries)LatviaLeast developed countries: UN classificationLebanonLibyaLithuaniaLow & middle incomeLow incomeLower middle incomeLuxembourgMacedonia, FYRMalaysiaMaltaMauritiusMexicoMiddle East & North AfricaMiddle East & North Africa (excluding high income)Middle East & North Africa (IDA & IBRD countries)Middle incomeMoldovaMongoliaMontenegroMoroccoMozambiqueMyanmarNamibiaNepalNetherlandsNew ZealandNicaraguaNigerNigeriaNorth AmericaNorwayOECD membersOmanOther small statesPakistanPanamaParaguayPeruPhilippinesPolandPortugalPost-demographic dividendPre-demographic dividendQatarRomaniaRussian FederationSaudi ArabiaSenegalSerbiaSingaporeSlovak RepublicSloveniaSmall statesSouth AfricaSouth AsiaSouth Asia (IDA & IBRD)South SudanSpainSri LankaSub-Saharan Africa Sub-Saharan Africa (excluding high income)Sub-Saharan Africa (IDA & IBRD countries)SudanSwedenSwitzerlandSyrian Arab RepublicTajikistanTanzaniaThailandTogoTrinidad and TobagoTunisiaTurkeyTurkmenistanUkraineUnited Arab EmiratesUnited KingdomUnited StatesUpper middle incomeUruguayUzbekistanVenezuela, RBVietnamWorldYemen, Rep.ZambiaZimbabwe Timeline:
This timeline shows a graph from 1961 to 2014 of European Union. No data until 1960. Number of actual observations by date: 54.
Source name:
World Development Indicators
Source organization:
IEA Statistics © OECD/IEA 2014 (http://www.iea.org/stats/index.asp), subject to https://www.iea.org/t&c/termsandconditions/
Categories, topics:
Environment
Last updated:
apr 23, 2017
Indicators value changes by year
Minimum:
12.031
jan 1, 1972
Maximum:
26.229
jan 1, 2010
At the date of observation
Value
Absolute change
Change from previous value
jan 1, 1961
12.206
+12.206
0.0%
jan 1, 1962
12.558
+0.352
2.88%
jan 1, 1963
12.358
-0.2
-1.59%
jan 1, 1964
12.295
-0.063
-0.51%
jan 1, 1965
12.336
+0.042
0.34%
jan 1, 1966
12.255
-0.082
-0.66%
jan 1, 1967
12.706
+0.451
3.68%
jan 1, 1968
12.829
+0.123
0.97%
jan 1, 1969
12.886
+0.057
0.45%
jan 1, 1970
12.515
-0.371
-2.88%
jan 1, 1971
12.229
-0.286
-2.28%
jan 1, 1972
12.031
-0.198
-1.62%
jan 1, 1973
12.328
+0.297
2.47%
jan 1, 1974
12.425
+0.098
0.79%
jan 1, 1975
12.347
-0.079
-0.63%
jan 1, 1976
13.092
+0.745
6.03%
jan 1, 1977
12.931
-0.16
-1.23%
jan 1, 1978
13.354
+0.423
3.27%
jan 1, 1979
13.604
+0.25
1.87%
jan 1, 1980
13.506
-0.098
-0.72%
jan 1, 1981
13.886
+0.38
2.82%
jan 1, 1982
14.195
+0.309
2.22%
jan 1, 1983
14.622
+0.427
3.01%
jan 1, 1984
14.984
+0.362
2.48%
jan 1, 1985
15.342
+0.358
2.39%
jan 1, 1986
15.239
-0.103
-0.67%
jan 1, 1987
15.816
+0.577
3.79%
jan 1, 1988
16.245
+0.43
2.72%
jan 1, 1989
17.286
+1.041
6.41%
jan 1, 1990
18.063
+0.776
4.49%
jan 1, 1991
18.819
+0.757
4.19%
jan 1, 1992
19.115
+0.296
1.57%
jan 1, 1993
20.251
+1.136
5.94%
jan 1, 1994
20.8
+0.549
2.71%
jan 1, 1995
21.097
+0.297
1.43%
jan 1, 1996
21.1
+0.003
0.01%
jan 1, 1997
21.138
+0.037
0.18%
jan 1, 1998
21.984
+0.846
4.0%
jan 1, 1999
22.764
+0.78
3.55%
jan 1, 2000
23.721
+0.957
4.2%
jan 1, 2001
23.566
-0.155
-0.65%
jan 1, 2002
23.466
-0.1
-0.42%
jan 1, 2003
23.833
+0.367
1.57%
jan 1, 2004
23.599
-0.234
-0.98%
jan 1, 2005
24.115
+0.516
2.19%
jan 1, 2006
24.267
+0.152
0.63%
jan 1, 2007
24.549
+0.282
1.16%
jan 1, 2008
25.133
+0.584
2.38%
jan 1, 2009
25.081
-0.053
-0.21%
jan 1, 2010
26.229
+1.149
4.58%
jan 1, 2011
25.253
-0.977
-3.72%
jan 1, 2012
25.967
+0.715
2.83%
jan 1, 2013
25.348
-0.619
-2.38%
jan 1, 2014
25.785
+0.436
1.72%
Ranking of countries by current statistics by years


Comments: