29
/
en
AIzaSyAYiBZKx7MnpbEhh9jyipgxe19OcubqV5w
April 1, 2024
43263
Latin America & the Caribbean (IDA & IBRD countries)
TLA
false
2
1
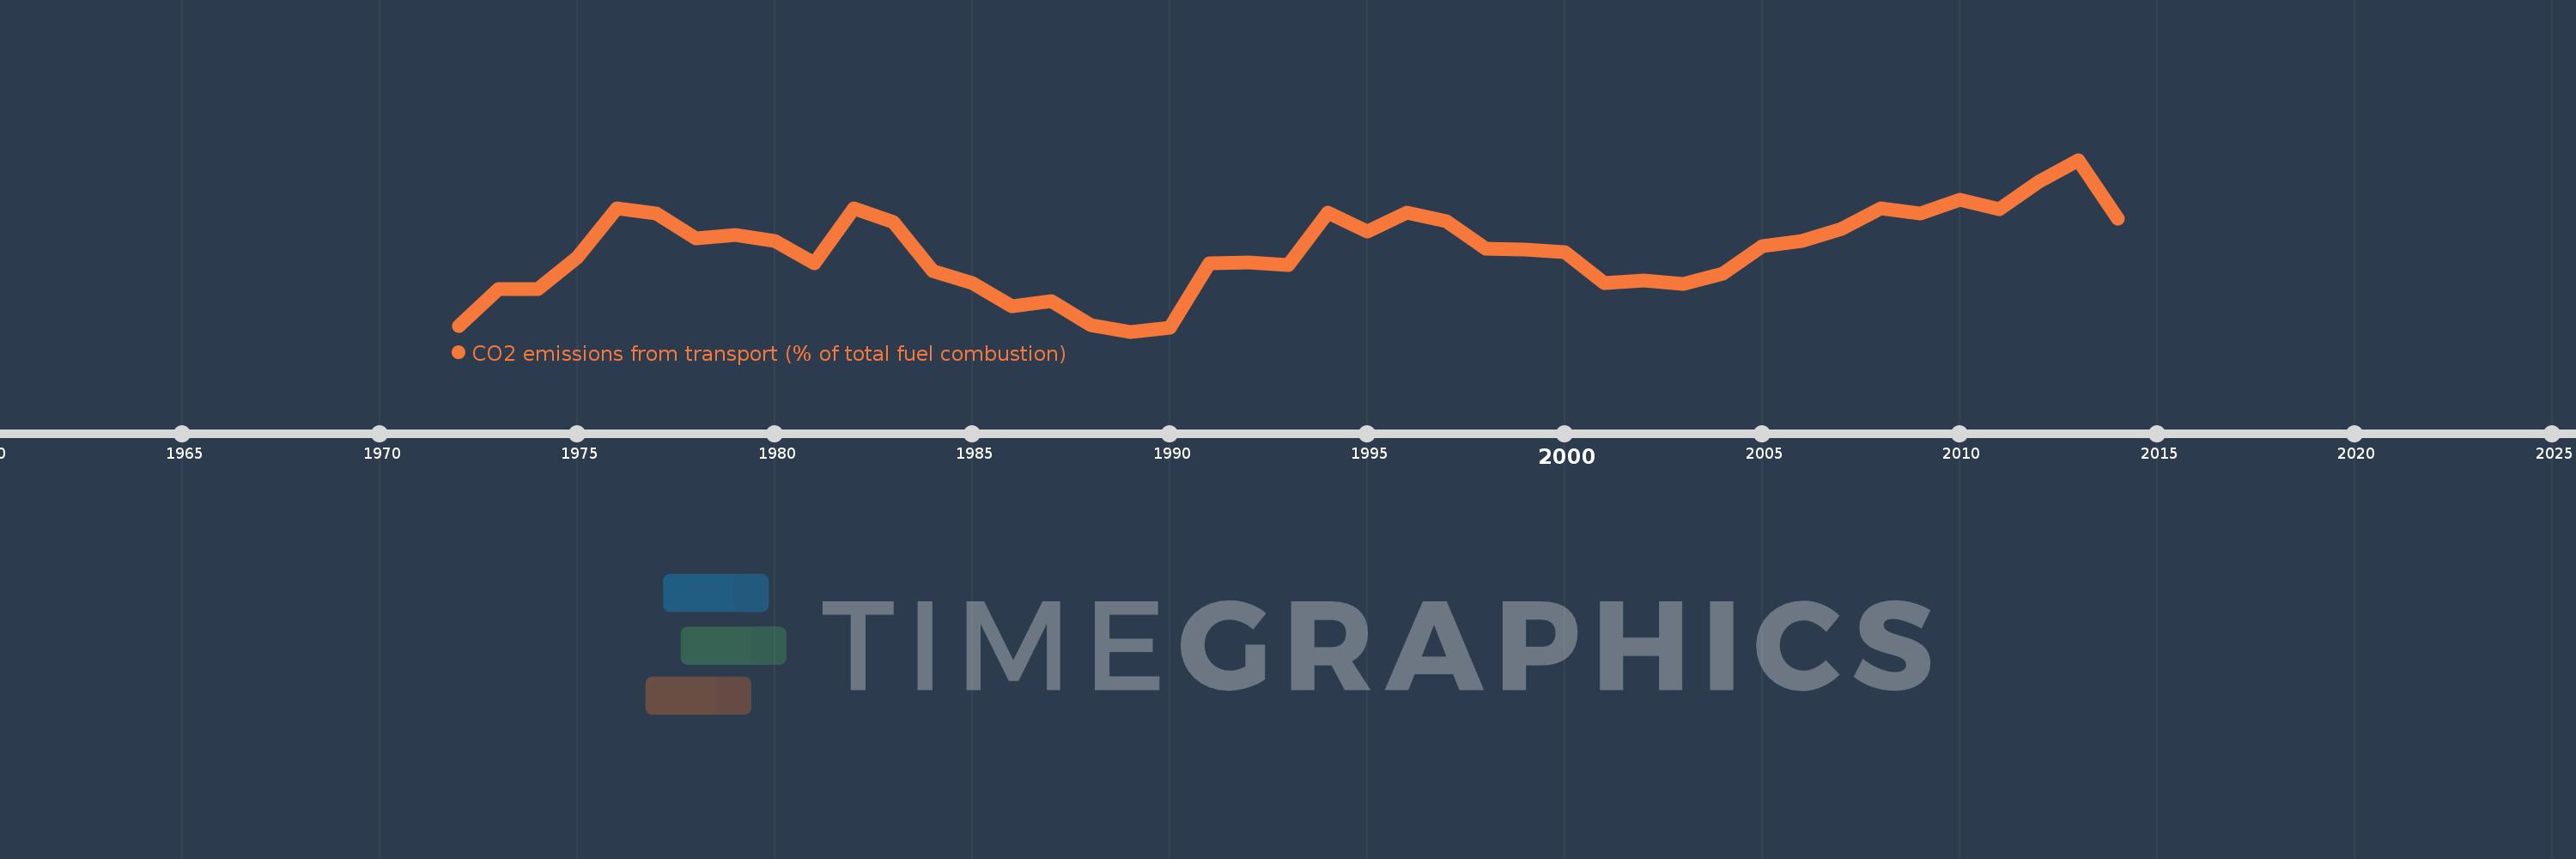
CO2 emissions from transport (% of total fuel combustion)
2014,2013,2012,2011,2010,2009,2008,2007,2006,2005,2004,2003,2002,2001,2000,1999,1998,1997,1996,1995,1994,1993,1992,1991,1990,1989,1988,1987,1986,1985,1984,1983,1982,1981,1980,1979,1978,1977,1976,1975,1974,1973,1972
This statistics in other country:
AlbaniaAlgeriaAngolaArab WorldArgentinaArmeniaAustraliaAustriaAzerbaijanBahrainBangladeshBelarusBelgiumBeninBoliviaBosnia and HerzegovinaBotswanaBrazilBrunei DarussalamBulgariaCambodiaCameroonCanadaCaribbean small statesCentral Europe and the BalticsChileChinaColombiaCongo, Dem. Rep.Congo, Rep.Costa RicaCote d'IvoireCroatiaCubaCuracaoCyprusCzech RepublicDenmarkDominican RepublicEarly-demographic dividendEast Asia & PacificEast Asia & Pacific (excluding high income)East Asia & Pacific (IDA & IBRD countries)EcuadorEgypt, Arab Rep.El SalvadorEritreaEstoniaEthiopiaEuro areaEurope & Central AsiaEurope & Central Asia (excluding high income)Europe & Central Asia (IDA & IBRD countries)European UnionFinlandFragile and conflict affected situationsFranceGabonGeorgiaGermanyGhanaGibraltarGreeceGuatemalaHaitiHeavily indebted poor countries (HIPC)High incomeHondurasHong Kong SAR, ChinaHungaryIBRD onlyIcelandIDA & IBRD totalIDA blendIDA onlyIDA totalIndiaIndonesiaIran, Islamic Rep.IraqIrelandIsraelItalyJamaicaJapanJordanKazakhstanKenyaKorea, Dem. People’s Rep.Korea, Rep.KosovoKuwaitKyrgyz RepublicLate-demographic dividendLatin America & Caribbean Latin America & Caribbean (excluding high income)Latin America & the Caribbean (IDA & IBRD countries)LatviaLeast developed countries: UN classificationLebanonLibyaLithuaniaLow & middle incomeLow incomeLower middle incomeLuxembourgMacedonia, FYRMalaysiaMaltaMauritiusMexicoMiddle East & North AfricaMiddle East & North Africa (excluding high income)Middle East & North Africa (IDA & IBRD countries)Middle incomeMoldovaMongoliaMontenegroMoroccoMozambiqueMyanmarNamibiaNepalNetherlandsNew ZealandNicaraguaNigerNigeriaNorth AmericaNorwayOECD membersOmanOther small statesPakistanPanamaParaguayPeruPhilippinesPolandPortugalPost-demographic dividendPre-demographic dividendQatarRomaniaRussian FederationSaudi ArabiaSenegalSerbiaSingaporeSlovak RepublicSloveniaSmall statesSouth AfricaSouth AsiaSouth Asia (IDA & IBRD)South SudanSpainSri LankaSub-Saharan Africa Sub-Saharan Africa (excluding high income)Sub-Saharan Africa (IDA & IBRD countries)SudanSwedenSwitzerlandSyrian Arab RepublicTajikistanTanzaniaThailandTogoTrinidad and TobagoTunisiaTurkeyTurkmenistanUkraineUnited Arab EmiratesUnited KingdomUnited StatesUpper middle incomeUruguayUzbekistanVenezuela, RBVietnamWorldYemen, Rep.ZambiaZimbabwe Timeline:
This timeline shows a graph from 1972 to 2014 of Latin America & the Caribbean (IDA & IBRD countries). No data until 1971. Number of actual observations by date: 43.
Source name:
World Development Indicators
Source organization:
IEA Statistics © OECD/IEA 2014 (http://www.iea.org/stats/index.asp), subject to https://www.iea.org/t&c/termsandconditions/
Categories, topics:
Environment
Last updated:
apr 23, 2017
Indicators value changes by year
Minimum:
34.003
jan 1, 1989
Maximum:
37.845
jan 1, 2013
At the date of observation
Value
Absolute change
Change from previous value
jan 1, 1972
34.12
+34.12
0.0%
jan 1, 1973
34.963
+0.842
2.47%
jan 1, 1974
34.963
+0.0
0.0%
jan 1, 1975
35.656
+0.693
1.98%
jan 1, 1976
36.764
+1.108
3.11%
jan 1, 1977
36.641
-0.124
-0.34%
jan 1, 1978
36.089
-0.552
-1.51%
jan 1, 1979
36.155
+0.066
0.18%
jan 1, 1980
36.031
-0.124
-0.34%
jan 1, 1981
35.522
-0.509
-1.41%
jan 1, 1982
36.768
+1.247
3.51%
jan 1, 1983
36.443
-0.326
-0.89%
jan 1, 1984
35.349
-1.094
-3.0%
jan 1, 1985
35.082
-0.267
-0.75%
jan 1, 1986
34.577
-0.505
-1.44%
jan 1, 1987
34.69
+0.113
0.33%
jan 1, 1988
34.151
-0.539
-1.55%
jan 1, 1989
34.003
-0.148
-0.43%
jan 1, 1990
34.09
+0.087
0.26%
jan 1, 1991
35.537
+1.447
4.25%
jan 1, 1992
35.557
+0.02
0.06%
jan 1, 1993
35.488
-0.069
-0.19%
jan 1, 1994
36.664
+1.176
3.31%
jan 1, 1995
36.24
-0.423
-1.15%
jan 1, 1996
36.669
+0.429
1.18%
jan 1, 1997
36.477
-0.192
-0.52%
jan 1, 1998
35.852
-0.625
-1.71%
jan 1, 1999
35.843
-0.009
-0.03%
jan 1, 2000
35.778
-0.066
-0.18%
jan 1, 2001
35.08
-0.698
-1.95%
jan 1, 2002
35.152
+0.072
0.21%
jan 1, 2003
35.066
-0.086
-0.25%
jan 1, 2004
35.292
+0.226
0.64%
jan 1, 2005
35.908
+0.616
1.75%
jan 1, 2006
36.022
+0.114
0.32%
jan 1, 2007
36.308
+0.286
0.79%
jan 1, 2008
36.752
+0.444
1.22%
jan 1, 2009
36.639
-0.113
-0.31%
jan 1, 2010
36.958
+0.318
0.87%
jan 1, 2011
36.734
-0.224
-0.61%
jan 1, 2012
37.363
+0.629
1.71%
jan 1, 2013
37.845
+0.482
1.29%
jan 1, 2014
36.535
-1.31
-3.46%
Ranking of countries by current statistics by years


Comments: