29
/
en
AIzaSyAYiBZKx7MnpbEhh9jyipgxe19OcubqV5w
April 1, 2024
116702
Cyprus
CYP
true
2
1
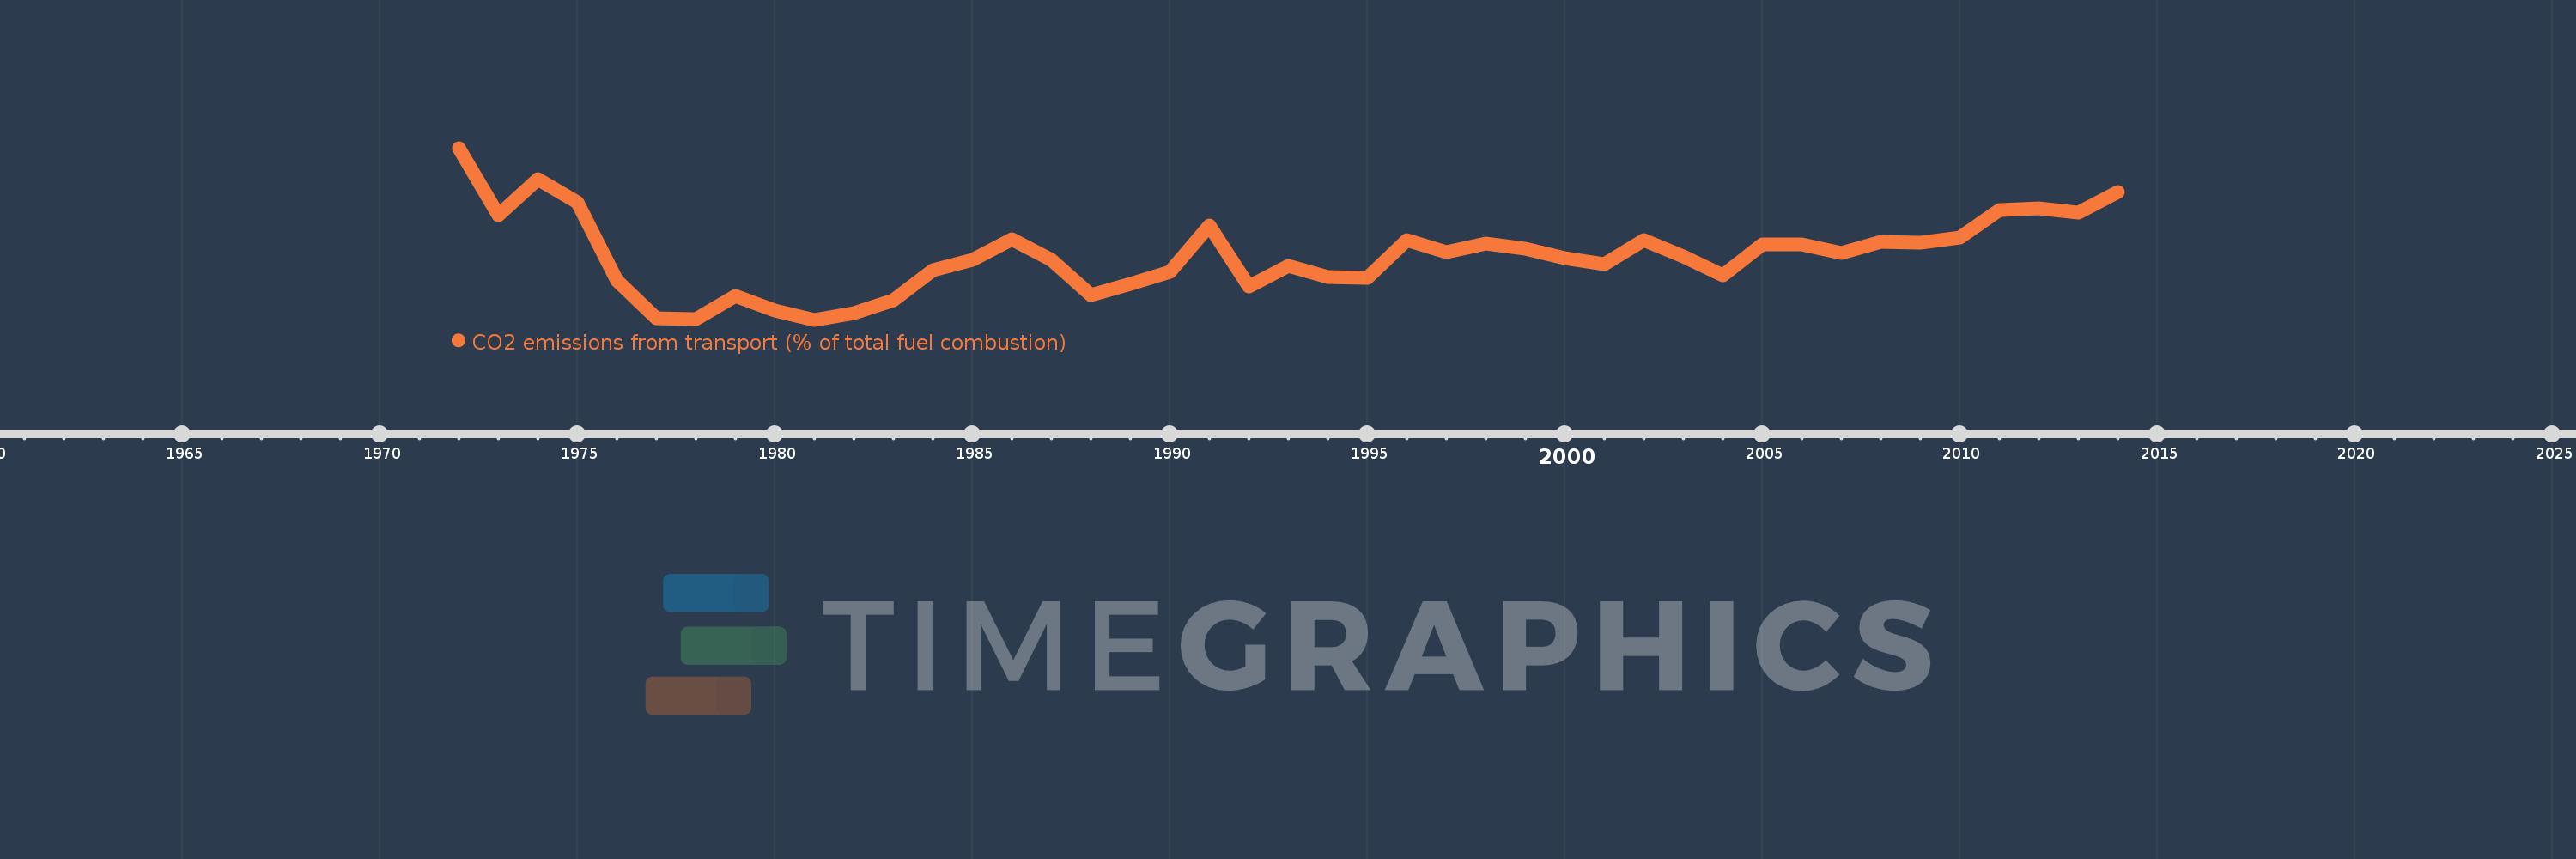
CO2 emissions from transport (% of total fuel combustion)
2014,2013,2012,2011,2010,2009,2008,2007,2006,2005,2004,2003,2002,2001,2000,1999,1998,1997,1996,1995,1994,1993,1992,1991,1990,1989,1988,1987,1986,1985,1984,1983,1982,1981,1980,1979,1978,1977,1976,1975,1974,1973,1972
This statistics in other country:
AlbaniaAlgeriaAngolaArab WorldArgentinaArmeniaAustraliaAustriaAzerbaijanBahrainBangladeshBelarusBelgiumBeninBoliviaBosnia and HerzegovinaBotswanaBrazilBrunei DarussalamBulgariaCambodiaCameroonCanadaCaribbean small statesCentral Europe and the BalticsChileChinaColombiaCongo, Dem. Rep.Congo, Rep.Costa RicaCote d'IvoireCroatiaCubaCuracaoCyprusCzech RepublicDenmarkDominican RepublicEarly-demographic dividendEast Asia & PacificEast Asia & Pacific (excluding high income)East Asia & Pacific (IDA & IBRD countries)EcuadorEgypt, Arab Rep.El SalvadorEritreaEstoniaEthiopiaEuro areaEurope & Central AsiaEurope & Central Asia (excluding high income)Europe & Central Asia (IDA & IBRD countries)European UnionFinlandFragile and conflict affected situationsFranceGabonGeorgiaGermanyGhanaGibraltarGreeceGuatemalaHaitiHeavily indebted poor countries (HIPC)High incomeHondurasHong Kong SAR, ChinaHungaryIBRD onlyIcelandIDA & IBRD totalIDA blendIDA onlyIDA totalIndiaIndonesiaIran, Islamic Rep.IraqIrelandIsraelItalyJamaicaJapanJordanKazakhstanKenyaKorea, Dem. People’s Rep.Korea, Rep.KosovoKuwaitKyrgyz RepublicLate-demographic dividendLatin America & Caribbean Latin America & Caribbean (excluding high income)Latin America & the Caribbean (IDA & IBRD countries)LatviaLeast developed countries: UN classificationLebanonLibyaLithuaniaLow & middle incomeLow incomeLower middle incomeLuxembourgMacedonia, FYRMalaysiaMaltaMauritiusMexicoMiddle East & North AfricaMiddle East & North Africa (excluding high income)Middle East & North Africa (IDA & IBRD countries)Middle incomeMoldovaMongoliaMontenegroMoroccoMozambiqueMyanmarNamibiaNepalNetherlandsNew ZealandNicaraguaNigerNigeriaNorth AmericaNorwayOECD membersOmanOther small statesPakistanPanamaParaguayPeruPhilippinesPolandPortugalPost-demographic dividendPre-demographic dividendQatarRomaniaRussian FederationSaudi ArabiaSenegalSerbiaSingaporeSlovak RepublicSloveniaSmall statesSouth AfricaSouth AsiaSouth Asia (IDA & IBRD)South SudanSpainSri LankaSub-Saharan Africa Sub-Saharan Africa (excluding high income)Sub-Saharan Africa (IDA & IBRD countries)SudanSwedenSwitzerlandSyrian Arab RepublicTajikistanTanzaniaThailandTogoTrinidad and TobagoTunisiaTurkeyTurkmenistanUkraineUnited Arab EmiratesUnited KingdomUnited StatesUpper middle incomeUruguayUzbekistanVenezuela, RBVietnamWorldYemen, Rep.ZambiaZimbabwe Timeline:
This timeline shows a graph from 1972 to 2014 of Cyprus. No data until 1971. Number of actual observations by date: 43.
Source name:
World Development Indicators
Source organization:
IEA Statistics © OECD/IEA 2014 (http://www.iea.org/stats/index.asp), subject to https://www.iea.org/t&c/termsandconditions/
Categories, topics:
Environment
Last updated:
apr 23, 2017
Indicators value changes by year
Minimum:
24.125
jan 1, 1981
Maximum:
34.483
jan 1, 1972
At the date of observation
Value
Absolute change
Change from previous value
jan 1, 1972
34.483
+34.483
0.0%
jan 1, 1973
30.415
-4.068
-11.8%
jan 1, 1974
32.599
+2.184
7.18%
jan 1, 1975
31.214
-1.385
-4.25%
jan 1, 1976
26.506
-4.708
-15.08%
jan 1, 1977
24.227
-2.279
-8.6%
jan 1, 1978
24.171
-0.056
-0.23%
jan 1, 1979
25.561
+1.39
5.75%
jan 1, 1980
24.691
-0.869
-3.4%
jan 1, 1981
24.125
-0.567
-2.3%
jan 1, 1982
24.506
+0.381
1.58%
jan 1, 1983
25.292
+0.786
3.21%
jan 1, 1984
27.099
+1.807
7.15%
jan 1, 1985
27.737
+0.638
2.35%
jan 1, 1986
28.986
+1.248
4.5%
jan 1, 1987
27.723
-1.263
-4.36%
jan 1, 1988
25.627
-2.096
-7.56%
jan 1, 1989
26.301
+0.675
2.63%
jan 1, 1990
27.034
+0.733
2.79%
jan 1, 1991
29.82
+2.786
10.31%
jan 1, 1992
26.126
-3.694
-12.39%
jan 1, 1993
27.368
+1.242
4.75%
jan 1, 1994
26.721
-0.648
-2.37%
jan 1, 1995
26.654
-0.067
-0.25%
jan 1, 1996
28.911
+2.257
8.47%
jan 1, 1997
28.224
-0.687
-2.37%
jan 1, 1998
28.702
+0.478
1.69%
jan 1, 1999
28.399
-0.303
-1.05%
jan 1, 2000
27.842
-0.557
-1.96%
jan 1, 2001
27.46
-0.382
-1.37%
jan 1, 2002
28.918
+1.457
5.31%
jan 1, 2003
27.918
-1.0
-3.46%
jan 1, 2004
26.781
-1.137
-4.07%
jan 1, 2005
28.654
+1.873
7.0%
jan 1, 2006
28.652
-0.002
-0.01%
jan 1, 2007
28.129
-0.523
-1.83%
jan 1, 2008
28.841
+0.712
2.53%
jan 1, 2009
28.76
-0.081
-0.28%
jan 1, 2010
29.067
+0.307
1.07%
jan 1, 2011
30.716
+1.65
5.68%
jan 1, 2012
30.857
+0.141
0.46%
jan 1, 2013
30.568
-0.289
-0.94%
jan 1, 2014
31.851
+1.282
4.19%
Ranking of countries by current statistics by years


Comments: