29
/
en
AIzaSyAYiBZKx7MnpbEhh9jyipgxe19OcubqV5w
April 1, 2024
157055
Iran, Islamic Rep.
IRN
true
2
1
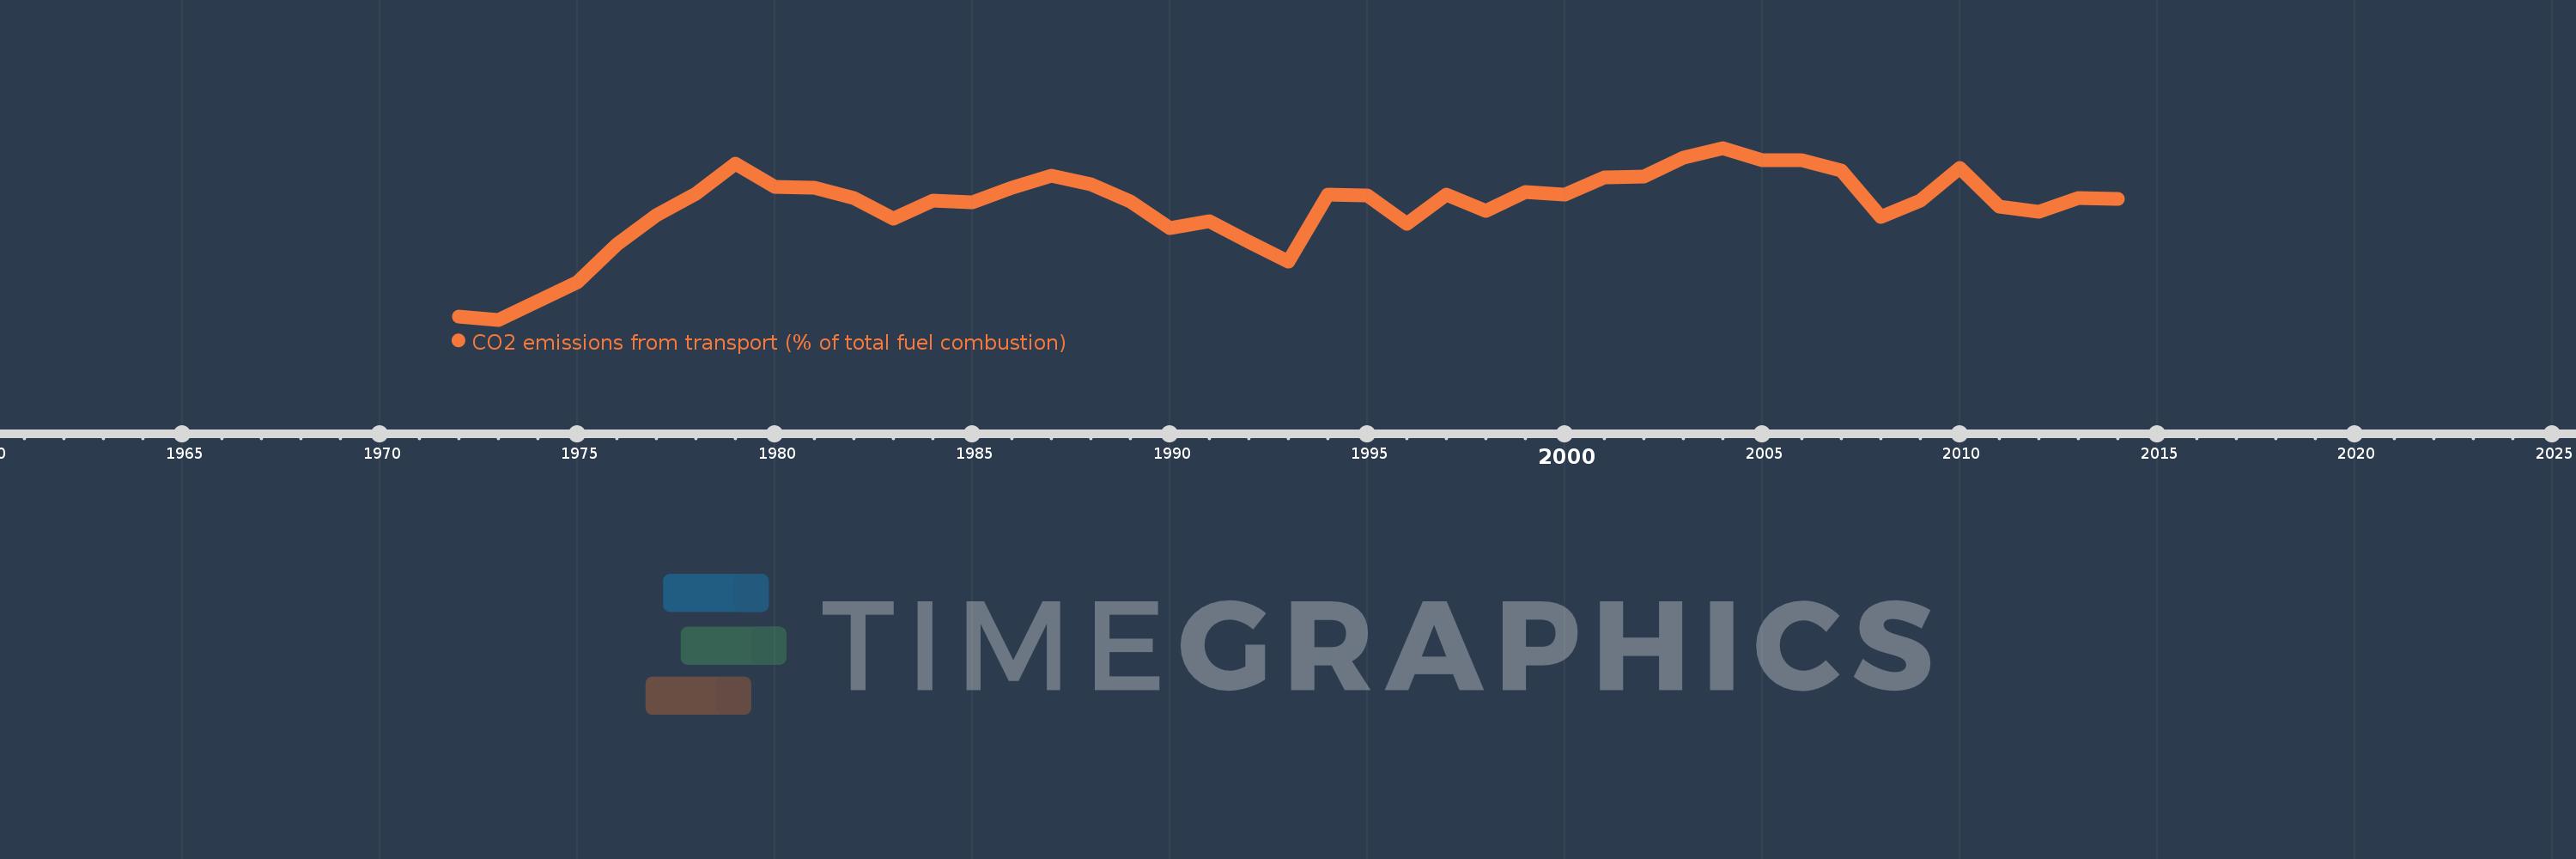
CO2 emissions from transport (% of total fuel combustion)
2014,2013,2012,2011,2010,2009,2008,2007,2006,2005,2004,2003,2002,2001,2000,1999,1998,1997,1996,1995,1994,1993,1992,1991,1990,1989,1988,1987,1986,1985,1984,1983,1982,1981,1980,1979,1978,1977,1976,1975,1974,1973,1972
This statistics in other country:
AlbaniaAlgeriaAngolaArab WorldArgentinaArmeniaAustraliaAustriaAzerbaijanBahrainBangladeshBelarusBelgiumBeninBoliviaBosnia and HerzegovinaBotswanaBrazilBrunei DarussalamBulgariaCambodiaCameroonCanadaCaribbean small statesCentral Europe and the BalticsChileChinaColombiaCongo, Dem. Rep.Congo, Rep.Costa RicaCote d'IvoireCroatiaCubaCuracaoCyprusCzech RepublicDenmarkDominican RepublicEarly-demographic dividendEast Asia & PacificEast Asia & Pacific (excluding high income)East Asia & Pacific (IDA & IBRD countries)EcuadorEgypt, Arab Rep.El SalvadorEritreaEstoniaEthiopiaEuro areaEurope & Central AsiaEurope & Central Asia (excluding high income)Europe & Central Asia (IDA & IBRD countries)European UnionFinlandFragile and conflict affected situationsFranceGabonGeorgiaGermanyGhanaGibraltarGreeceGuatemalaHaitiHeavily indebted poor countries (HIPC)High incomeHondurasHong Kong SAR, ChinaHungaryIBRD onlyIcelandIDA & IBRD totalIDA blendIDA onlyIDA totalIndiaIndonesiaIran, Islamic Rep.IraqIrelandIsraelItalyJamaicaJapanJordanKazakhstanKenyaKorea, Dem. People’s Rep.Korea, Rep.KosovoKuwaitKyrgyz RepublicLate-demographic dividendLatin America & Caribbean Latin America & Caribbean (excluding high income)Latin America & the Caribbean (IDA & IBRD countries)LatviaLeast developed countries: UN classificationLebanonLibyaLithuaniaLow & middle incomeLow incomeLower middle incomeLuxembourgMacedonia, FYRMalaysiaMaltaMauritiusMexicoMiddle East & North AfricaMiddle East & North Africa (excluding high income)Middle East & North Africa (IDA & IBRD countries)Middle incomeMoldovaMongoliaMontenegroMoroccoMozambiqueMyanmarNamibiaNepalNetherlandsNew ZealandNicaraguaNigerNigeriaNorth AmericaNorwayOECD membersOmanOther small statesPakistanPanamaParaguayPeruPhilippinesPolandPortugalPost-demographic dividendPre-demographic dividendQatarRomaniaRussian FederationSaudi ArabiaSenegalSerbiaSingaporeSlovak RepublicSloveniaSmall statesSouth AfricaSouth AsiaSouth Asia (IDA & IBRD)South SudanSpainSri LankaSub-Saharan Africa Sub-Saharan Africa (excluding high income)Sub-Saharan Africa (IDA & IBRD countries)SudanSwedenSwitzerlandSyrian Arab RepublicTajikistanTanzaniaThailandTogoTrinidad and TobagoTunisiaTurkeyTurkmenistanUkraineUnited Arab EmiratesUnited KingdomUnited StatesUpper middle incomeUruguayUzbekistanVenezuela, RBVietnamWorldYemen, Rep.ZambiaZimbabwe Timeline:
This timeline shows a graph from 1972 to 2014 of Iran, Islamic Rep.. No data until 1971. Number of actual observations by date: 43.
Source name:
World Development Indicators
Source organization:
IEA Statistics © OECD/IEA 2014 (http://www.iea.org/stats/index.asp), subject to https://www.iea.org/t&c/termsandconditions/
Categories, topics:
Environment
Last updated:
apr 23, 2017
Indicators value changes by year
Minimum:
19.233
jan 1, 1973
Maximum:
25.585
jan 1, 2004
At the date of observation
Value
Absolute change
Change from previous value
jan 1, 1972
19.362
+19.362
0.0%
jan 1, 1973
19.233
-0.13
-0.67%
jan 1, 1974
19.915
+0.683
3.55%
jan 1, 1975
20.62
+0.705
3.54%
jan 1, 1976
22.026
+1.406
6.82%
jan 1, 1977
23.098
+1.072
4.86%
jan 1, 1978
23.891
+0.793
3.43%
jan 1, 1979
24.988
+1.098
4.59%
jan 1, 1980
24.133
-0.856
-3.42%
jan 1, 1981
24.121
-0.012
-0.05%
jan 1, 1982
23.74
-0.381
-1.58%
jan 1, 1983
22.969
-0.771
-3.25%
jan 1, 1984
23.652
+0.683
2.97%
jan 1, 1985
23.56
-0.092
-0.39%
jan 1, 1986
24.119
+0.559
2.37%
jan 1, 1987
24.563
+0.444
1.84%
jan 1, 1988
24.23
-0.333
-1.36%
jan 1, 1989
23.62
-0.611
-2.52%
jan 1, 1990
22.626
-0.994
-4.21%
jan 1, 1991
22.865
+0.239
1.06%
jan 1, 1992
22.129
-0.736
-3.22%
jan 1, 1993
21.391
-0.738
-3.33%
jan 1, 1994
23.849
+2.459
11.49%
jan 1, 1995
23.814
-0.035
-0.15%
jan 1, 1996
22.783
-1.031
-4.33%
jan 1, 1997
23.856
+1.073
4.71%
jan 1, 1998
23.244
-0.612
-2.57%
jan 1, 1999
23.952
+0.708
3.05%
jan 1, 2000
23.853
-0.099
-0.41%
jan 1, 2001
24.497
+0.644
2.7%
jan 1, 2002
24.536
+0.038
0.16%
jan 1, 2003
25.238
+0.702
2.86%
jan 1, 2004
25.585
+0.347
1.38%
jan 1, 2005
25.13
-0.455
-1.78%
jan 1, 2006
25.119
-0.011
-0.04%
jan 1, 2007
24.739
-0.38
-1.51%
jan 1, 2008
23.029
-1.71
-6.91%
jan 1, 2009
23.646
+0.616
2.68%
jan 1, 2010
24.831
+1.186
5.01%
jan 1, 2011
23.417
-1.415
-5.7%
jan 1, 2012
23.238
-0.178
-0.76%
jan 1, 2013
23.741
+0.503
2.16%
jan 1, 2014
23.713
-0.028
-0.12%
Ranking of countries by current statistics by years


Comments: