29
/
en
AIzaSyAYiBZKx7MnpbEhh9jyipgxe19OcubqV5w
April 1, 2024
141313
Gibraltar
GIB
true
2
1
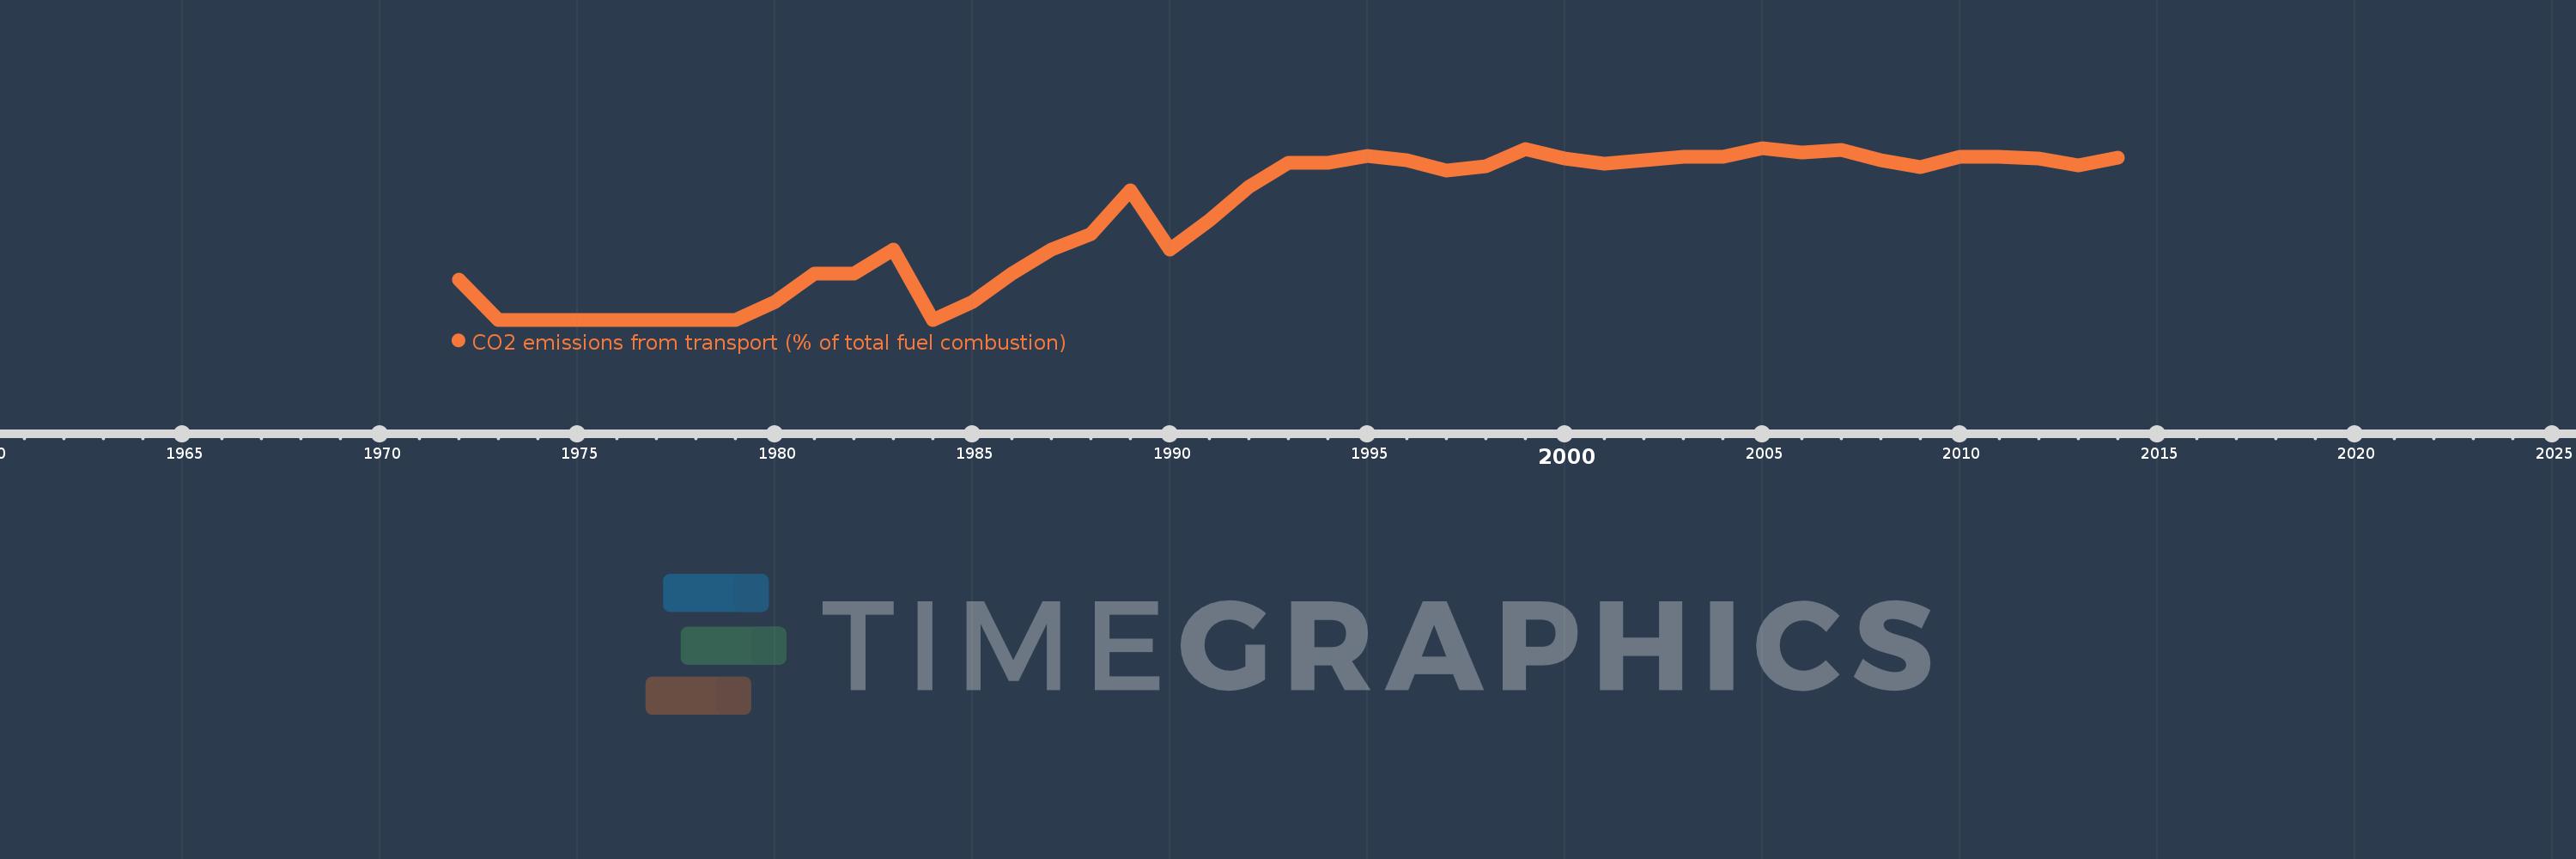
CO2 emissions from transport (% of total fuel combustion)
2014,2013,2012,2011,2010,2009,2008,2007,2006,2005,2004,2003,2002,2001,2000,1999,1998,1997,1996,1995,1994,1993,1992,1991,1990,1989,1988,1987,1986,1985,1984,1983,1982,1981,1980,1979,1978,1977,1976,1975,1974,1973,1972
This statistics in other country:
AlbaniaAlgeriaAngolaArab WorldArgentinaArmeniaAustraliaAustriaAzerbaijanBahrainBangladeshBelarusBelgiumBeninBoliviaBosnia and HerzegovinaBotswanaBrazilBrunei DarussalamBulgariaCambodiaCameroonCanadaCaribbean small statesCentral Europe and the BalticsChileChinaColombiaCongo, Dem. Rep.Congo, Rep.Costa RicaCote d'IvoireCroatiaCubaCuracaoCyprusCzech RepublicDenmarkDominican RepublicEarly-demographic dividendEast Asia & PacificEast Asia & Pacific (excluding high income)East Asia & Pacific (IDA & IBRD countries)EcuadorEgypt, Arab Rep.El SalvadorEritreaEstoniaEthiopiaEuro areaEurope & Central AsiaEurope & Central Asia (excluding high income)Europe & Central Asia (IDA & IBRD countries)European UnionFinlandFragile and conflict affected situationsFranceGabonGeorgiaGermanyGhanaGibraltarGreeceGuatemalaHaitiHeavily indebted poor countries (HIPC)High incomeHondurasHong Kong SAR, ChinaHungaryIBRD onlyIcelandIDA & IBRD totalIDA blendIDA onlyIDA totalIndiaIndonesiaIran, Islamic Rep.IraqIrelandIsraelItalyJamaicaJapanJordanKazakhstanKenyaKorea, Dem. People’s Rep.Korea, Rep.KosovoKuwaitKyrgyz RepublicLate-demographic dividendLatin America & Caribbean Latin America & Caribbean (excluding high income)Latin America & the Caribbean (IDA & IBRD countries)LatviaLeast developed countries: UN classificationLebanonLibyaLithuaniaLow & middle incomeLow incomeLower middle incomeLuxembourgMacedonia, FYRMalaysiaMaltaMauritiusMexicoMiddle East & North AfricaMiddle East & North Africa (excluding high income)Middle East & North Africa (IDA & IBRD countries)Middle incomeMoldovaMongoliaMontenegroMoroccoMozambiqueMyanmarNamibiaNepalNetherlandsNew ZealandNicaraguaNigerNigeriaNorth AmericaNorwayOECD membersOmanOther small statesPakistanPanamaParaguayPeruPhilippinesPolandPortugalPost-demographic dividendPre-demographic dividendQatarRomaniaRussian FederationSaudi ArabiaSenegalSerbiaSingaporeSlovak RepublicSloveniaSmall statesSouth AfricaSouth AsiaSouth Asia (IDA & IBRD)South SudanSpainSri LankaSub-Saharan Africa Sub-Saharan Africa (excluding high income)Sub-Saharan Africa (IDA & IBRD countries)SudanSwedenSwitzerlandSyrian Arab RepublicTajikistanTanzaniaThailandTogoTrinidad and TobagoTunisiaTurkeyTurkmenistanUkraineUnited Arab EmiratesUnited KingdomUnited StatesUpper middle incomeUruguayUzbekistanVenezuela, RBVietnamWorldYemen, Rep.ZambiaZimbabwe Timeline:
This timeline shows a graph from 1972 to 2014 of Gibraltar. No data until 1971. Number of actual observations by date: 43.
Source name:
World Development Indicators
Source organization:
IEA Statistics © OECD/IEA 2014 (http://www.iea.org/stats/index.asp), subject to https://www.iea.org/t&c/termsandconditions/
Categories, topics:
Environment
Last updated:
apr 23, 2017
Indicators value changes by year
Minimum:
33.333
jan 1, 1973
Maximum:
74.359
jan 1, 2005
At the date of observation
Value
Absolute change
Change from previous value
jan 1, 1972
42.857
+42.857
0.0%
jan 1, 1973
33.333
-9.524
-22.22%
jan 1, 1974
33.333
0.0
0.0%
jan 1, 1975
33.333
0.0
0.0%
jan 1, 1976
33.333
0.0
0.0%
jan 1, 1977
33.333
0.0
0.0%
jan 1, 1978
33.333
0.0
0.0%
jan 1, 1979
33.333
0.0
0.0%
jan 1, 1980
37.5
+4.167
12.5%
jan 1, 1981
44.444
+6.944
18.52%
jan 1, 1982
44.444
0.0
0.0%
jan 1, 1983
50.0
+5.556
12.5%
jan 1, 1984
33.333
-16.667
-33.33%
jan 1, 1985
37.5
+4.167
12.5%
jan 1, 1986
44.444
+6.944
18.52%
jan 1, 1987
50.0
+5.556
12.5%
jan 1, 1988
53.846
+3.846
7.69%
jan 1, 1989
64.286
+10.44
19.39%
jan 1, 1990
50.0
-14.286
-22.22%
jan 1, 1991
57.143
+7.143
14.29%
jan 1, 1992
65.0
+7.857
13.75%
jan 1, 1993
70.833
+5.833
8.97%
jan 1, 1994
70.833
0.0
0.0%
jan 1, 1995
72.414
+1.58
2.23%
jan 1, 1996
71.429
-0.985
-1.36%
jan 1, 1997
68.966
-2.463
-3.45%
jan 1, 1998
70.0
+1.034
1.5%
jan 1, 1999
74.194
+4.194
5.99%
jan 1, 2000
71.875
-2.319
-3.13%
jan 1, 2001
70.588
-1.287
-1.79%
jan 1, 2002
71.429
+0.84
1.19%
jan 1, 2003
72.222
+0.794
1.11%
jan 1, 2004
72.222
0.0
0.0%
jan 1, 2005
74.359
+2.137
2.96%
jan 1, 2006
73.171
-1.188
-1.6%
jan 1, 2007
73.81
+0.639
0.87%
jan 1, 2008
71.429
-2.381
-3.23%
jan 1, 2009
69.767
-1.661
-2.33%
jan 1, 2010
72.34
+2.573
3.69%
jan 1, 2011
72.34
0.0
0.0%
jan 1, 2012
71.739
-0.601
-0.83%
jan 1, 2013
70.213
-1.526
-2.13%
jan 1, 2014
72.0
+1.787
2.55%
Ranking of countries by current statistics by years


Comments: