29
/
en
AIzaSyAYiBZKx7MnpbEhh9jyipgxe19OcubqV5w
April 1, 2024
248450
Sri Lanka
LKA
true
2
1
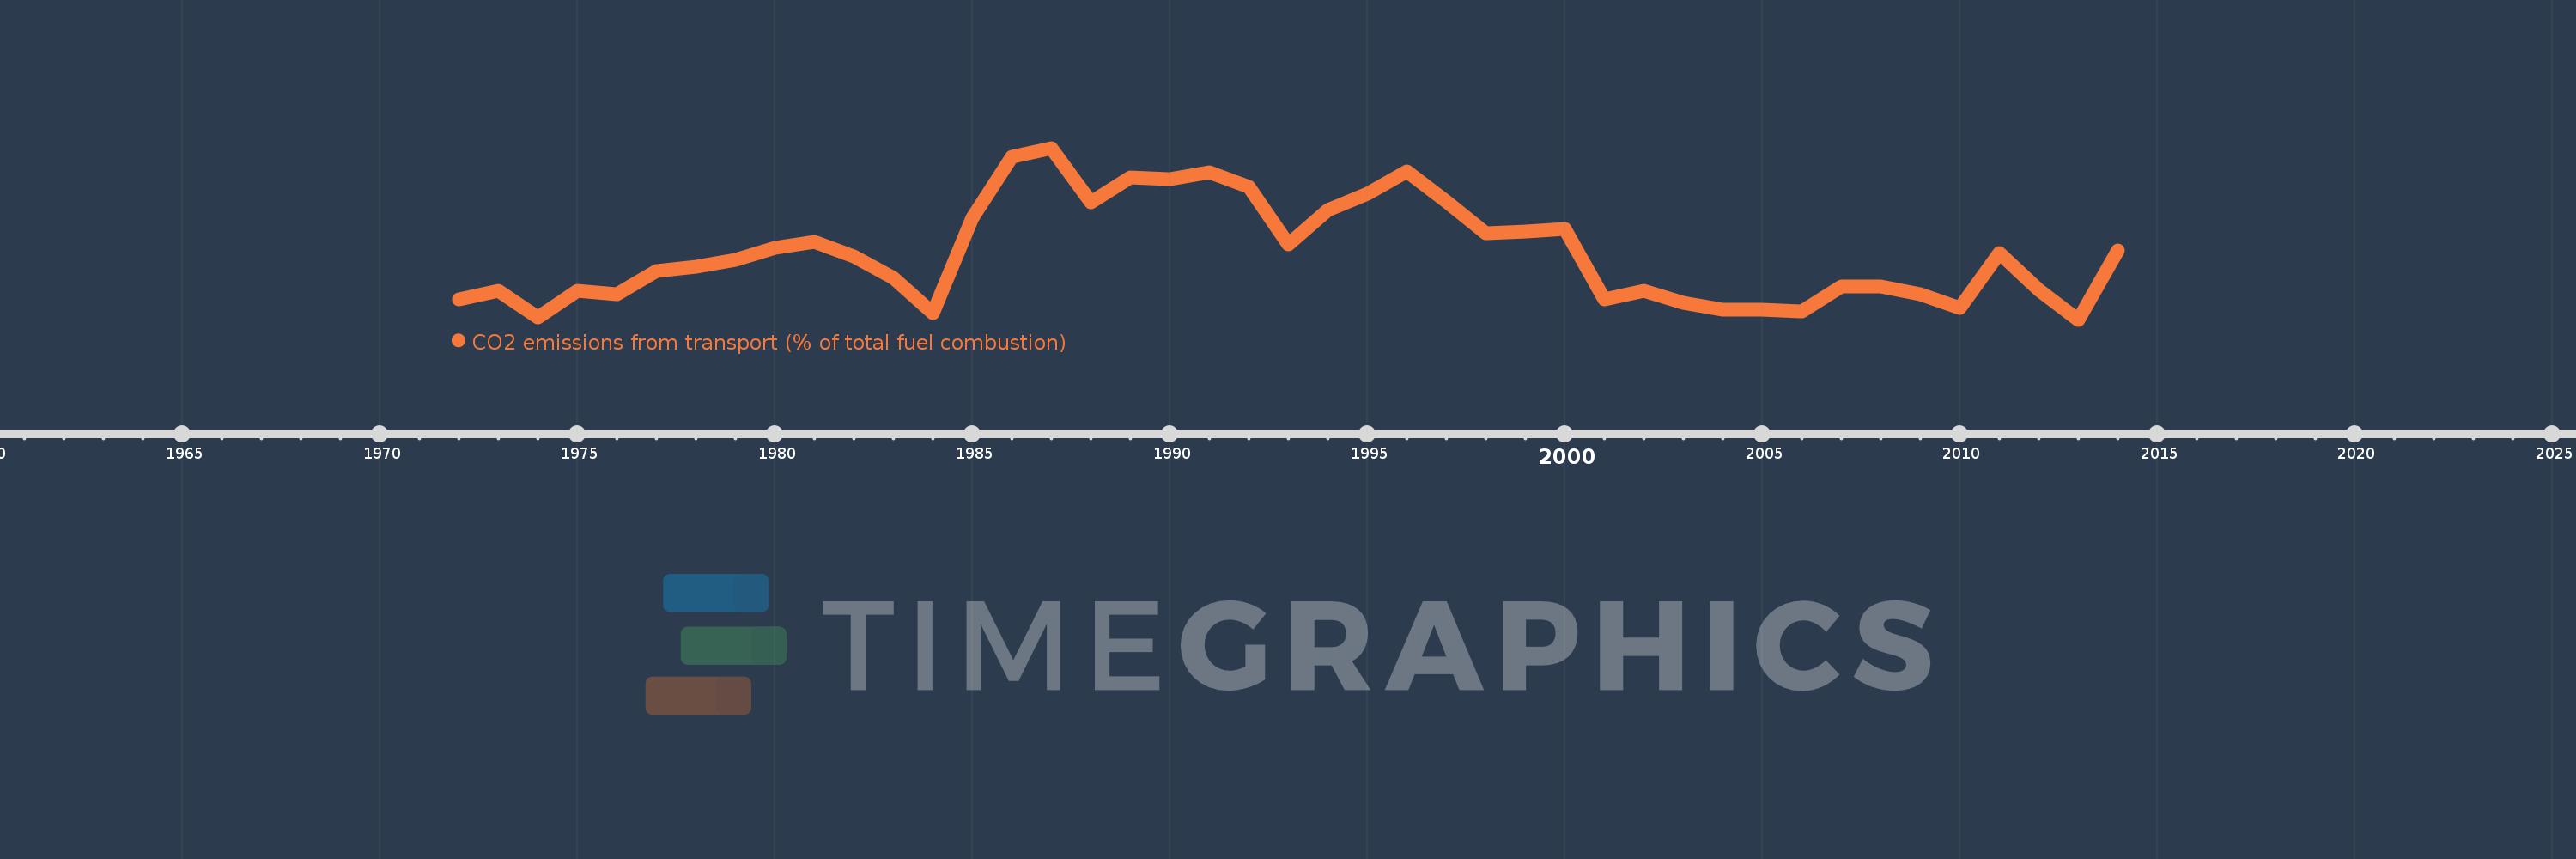
CO2 emissions from transport (% of total fuel combustion)
2014,2013,2012,2011,2010,2009,2008,2007,2006,2005,2004,2003,2002,2001,2000,1999,1998,1997,1996,1995,1994,1993,1992,1991,1990,1989,1988,1987,1986,1985,1984,1983,1982,1981,1980,1979,1978,1977,1976,1975,1974,1973,1972
This statistics in other country:
AlbaniaAlgeriaAngolaArab WorldArgentinaArmeniaAustraliaAustriaAzerbaijanBahrainBangladeshBelarusBelgiumBeninBoliviaBosnia and HerzegovinaBotswanaBrazilBrunei DarussalamBulgariaCambodiaCameroonCanadaCaribbean small statesCentral Europe and the BalticsChileChinaColombiaCongo, Dem. Rep.Congo, Rep.Costa RicaCote d'IvoireCroatiaCubaCuracaoCyprusCzech RepublicDenmarkDominican RepublicEarly-demographic dividendEast Asia & PacificEast Asia & Pacific (excluding high income)East Asia & Pacific (IDA & IBRD countries)EcuadorEgypt, Arab Rep.El SalvadorEritreaEstoniaEthiopiaEuro areaEurope & Central AsiaEurope & Central Asia (excluding high income)Europe & Central Asia (IDA & IBRD countries)European UnionFinlandFragile and conflict affected situationsFranceGabonGeorgiaGermanyGhanaGibraltarGreeceGuatemalaHaitiHeavily indebted poor countries (HIPC)High incomeHondurasHong Kong SAR, ChinaHungaryIBRD onlyIcelandIDA & IBRD totalIDA blendIDA onlyIDA totalIndiaIndonesiaIran, Islamic Rep.IraqIrelandIsraelItalyJamaicaJapanJordanKazakhstanKenyaKorea, Dem. People’s Rep.Korea, Rep.KosovoKuwaitKyrgyz RepublicLate-demographic dividendLatin America & Caribbean Latin America & Caribbean (excluding high income)Latin America & the Caribbean (IDA & IBRD countries)LatviaLeast developed countries: UN classificationLebanonLibyaLithuaniaLow & middle incomeLow incomeLower middle incomeLuxembourgMacedonia, FYRMalaysiaMaltaMauritiusMexicoMiddle East & North AfricaMiddle East & North Africa (excluding high income)Middle East & North Africa (IDA & IBRD countries)Middle incomeMoldovaMongoliaMontenegroMoroccoMozambiqueMyanmarNamibiaNepalNetherlandsNew ZealandNicaraguaNigerNigeriaNorth AmericaNorwayOECD membersOmanOther small statesPakistanPanamaParaguayPeruPhilippinesPolandPortugalPost-demographic dividendPre-demographic dividendQatarRomaniaRussian FederationSaudi ArabiaSenegalSerbiaSingaporeSlovak RepublicSloveniaSmall statesSouth AfricaSouth AsiaSouth Asia (IDA & IBRD)South SudanSpainSri LankaSub-Saharan Africa Sub-Saharan Africa (excluding high income)Sub-Saharan Africa (IDA & IBRD countries)SudanSwedenSwitzerlandSyrian Arab RepublicTajikistanTanzaniaThailandTogoTrinidad and TobagoTunisiaTurkeyTurkmenistanUkraineUnited Arab EmiratesUnited KingdomUnited StatesUpper middle incomeUruguayUzbekistanVenezuela, RBVietnamWorldYemen, Rep.ZambiaZimbabwe Timeline:
This timeline shows a graph from 1972 to 2014 of Sri Lanka. No data until 1971. Number of actual observations by date: 43.
Source name:
World Development Indicators
Source organization:
IEA Statistics © OECD/IEA 2014 (http://www.iea.org/stats/index.asp), subject to https://www.iea.org/t&c/termsandconditions/
Categories, topics:
Environment
Last updated:
apr 23, 2017
Indicators value changes by year
Maximum:
71.429
jan 1, 1987
At the date of observation
Value
Absolute change
Change from previous value
jan 1, 1972
48.913
+48.913
0.0%
jan 1, 1973
50.147
+1.234
2.52%
jan 1, 1974
46.176
-3.972
-7.92%
jan 1, 1975
50.173
+3.997
8.66%
jan 1, 1976
49.621
-0.552
-1.1%
jan 1, 1977
53.16
+3.539
7.13%
jan 1, 1978
53.793
+0.633
1.19%
jan 1, 1979
54.79
+0.997
1.85%
jan 1, 1980
56.63
+1.839
3.36%
jan 1, 1981
57.459
+0.829
1.46%
jan 1, 1982
55.319
-2.139
-3.72%
jan 1, 1983
52.133
-3.186
-5.76%
jan 1, 1984
46.847
-5.286
-10.14%
jan 1, 1985
60.995
+14.148
30.2%
jan 1, 1986
70.115
+9.12
14.95%
jan 1, 1987
71.429
+1.314
1.87%
jan 1, 1988
63.384
-8.045
-11.26%
jan 1, 1989
67.109
+3.725
5.88%
jan 1, 1990
66.852
-0.256
-0.38%
jan 1, 1991
67.847
+0.995
1.49%
jan 1, 1992
65.707
-2.141
-3.16%
jan 1, 1993
57.026
-8.68
-13.21%
jan 1, 1994
62.162
+5.136
9.01%
jan 1, 1995
64.564
+2.402
3.86%
jan 1, 1996
67.89
+3.326
5.15%
jan 1, 1997
63.534
-4.356
-6.42%
jan 1, 1998
58.742
-4.792
-7.54%
jan 1, 1999
59.03
+0.288
0.49%
jan 1, 2000
59.341
+0.31
0.53%
jan 1, 2001
48.954
-10.386
-17.5%
jan 1, 2002
50.192
+1.238
2.53%
jan 1, 2003
48.405
-1.788
-3.56%
jan 1, 2004
47.364
-1.041
-2.15%
jan 1, 2005
47.441
+0.077
0.16%
jan 1, 2006
47.125
-0.316
-0.67%
jan 1, 2007
50.849
+3.724
7.9%
jan 1, 2008
50.812
-0.037
-0.07%
jan 1, 2009
49.67
-1.142
-2.25%
jan 1, 2010
47.578
-2.092
-4.21%
jan 1, 2011
55.806
+8.229
17.3%
jan 1, 2012
50.307
-5.5
-9.85%
jan 1, 2013
45.89
-4.416
-8.78%
jan 1, 2014
56.186
+10.296
22.44%
Ranking of countries by current statistics by years


Comments: