29
/
en
AIzaSyAYiBZKx7MnpbEhh9jyipgxe19OcubqV5w
April 1, 2024
50720
Middle income
MIC
false
2
1
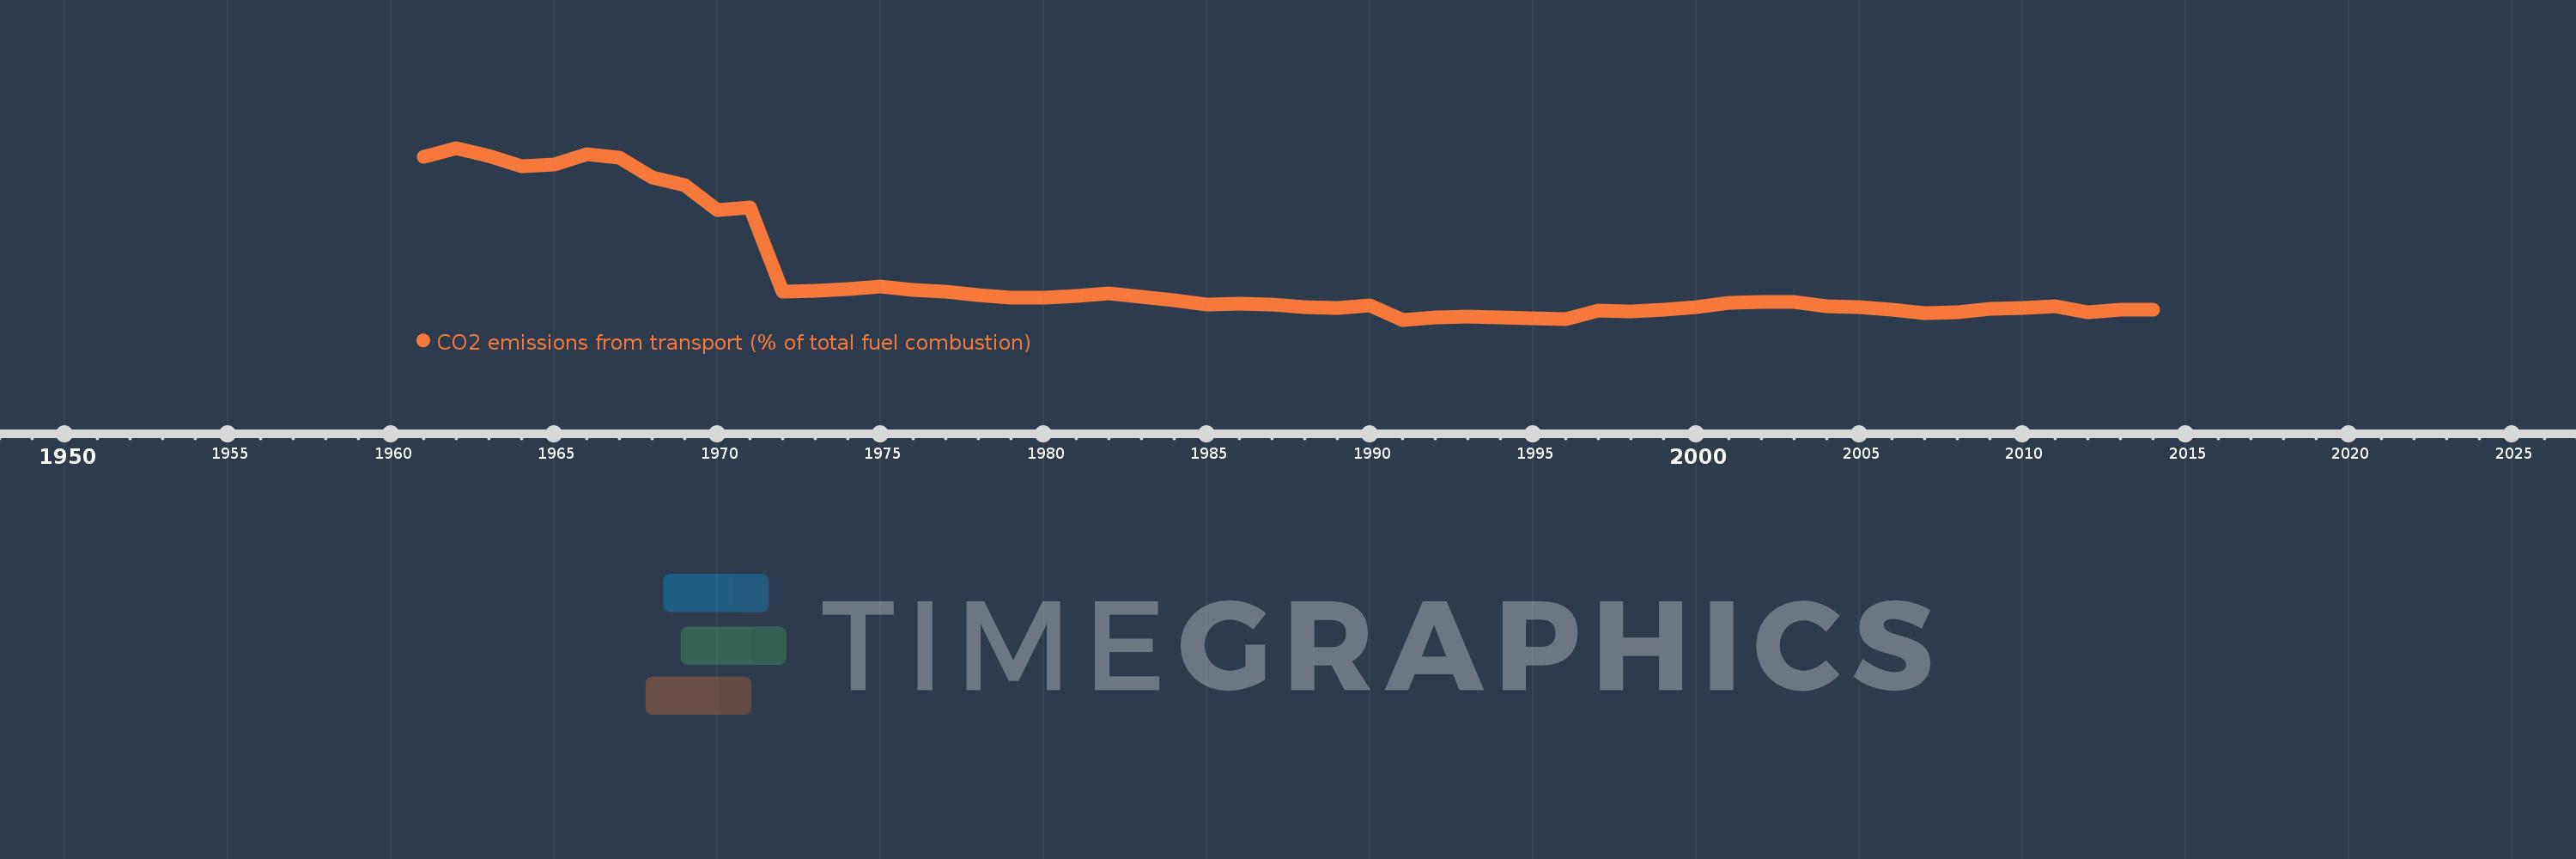
CO2 emissions from transport (% of total fuel combustion)
2014,2013,2012,2011,2010,2009,2008,2007,2006,2005,2004,2003,2002,2001,2000,1999,1998,1997,1996,1995,1994,1993,1992,1991,1990,1989,1988,1987,1986,1985,1984,1983,1982,1981,1980,1979,1978,1977,1976,1975,1974,1973,1972,1971,1970,1969,1968,1967,1966,1965,1964,1963,1962,1961
This statistics in other country:
AlbaniaAlgeriaAngolaArab WorldArgentinaArmeniaAustraliaAustriaAzerbaijanBahrainBangladeshBelarusBelgiumBeninBoliviaBosnia and HerzegovinaBotswanaBrazilBrunei DarussalamBulgariaCambodiaCameroonCanadaCaribbean small statesCentral Europe and the BalticsChileChinaColombiaCongo, Dem. Rep.Congo, Rep.Costa RicaCote d'IvoireCroatiaCubaCuracaoCyprusCzech RepublicDenmarkDominican RepublicEarly-demographic dividendEast Asia & PacificEast Asia & Pacific (excluding high income)East Asia & Pacific (IDA & IBRD countries)EcuadorEgypt, Arab Rep.El SalvadorEritreaEstoniaEthiopiaEuro areaEurope & Central AsiaEurope & Central Asia (excluding high income)Europe & Central Asia (IDA & IBRD countries)European UnionFinlandFragile and conflict affected situationsFranceGabonGeorgiaGermanyGhanaGibraltarGreeceGuatemalaHaitiHeavily indebted poor countries (HIPC)High incomeHondurasHong Kong SAR, ChinaHungaryIBRD onlyIcelandIDA & IBRD totalIDA blendIDA onlyIDA totalIndiaIndonesiaIran, Islamic Rep.IraqIrelandIsraelItalyJamaicaJapanJordanKazakhstanKenyaKorea, Dem. People’s Rep.Korea, Rep.KosovoKuwaitKyrgyz RepublicLate-demographic dividendLatin America & Caribbean Latin America & Caribbean (excluding high income)Latin America & the Caribbean (IDA & IBRD countries)LatviaLeast developed countries: UN classificationLebanonLibyaLithuaniaLow & middle incomeLow incomeLower middle incomeLuxembourgMacedonia, FYRMalaysiaMaltaMauritiusMexicoMiddle East & North AfricaMiddle East & North Africa (excluding high income)Middle East & North Africa (IDA & IBRD countries)Middle incomeMoldovaMongoliaMontenegroMoroccoMozambiqueMyanmarNamibiaNepalNetherlandsNew ZealandNicaraguaNigerNigeriaNorth AmericaNorwayOECD membersOmanOther small statesPakistanPanamaParaguayPeruPhilippinesPolandPortugalPost-demographic dividendPre-demographic dividendQatarRomaniaRussian FederationSaudi ArabiaSenegalSerbiaSingaporeSlovak RepublicSloveniaSmall statesSouth AfricaSouth AsiaSouth Asia (IDA & IBRD)South SudanSpainSri LankaSub-Saharan Africa Sub-Saharan Africa (excluding high income)Sub-Saharan Africa (IDA & IBRD countries)SudanSwedenSwitzerlandSyrian Arab RepublicTajikistanTanzaniaThailandTogoTrinidad and TobagoTunisiaTurkeyTurkmenistanUkraineUnited Arab EmiratesUnited KingdomUnited StatesUpper middle incomeUruguayUzbekistanVenezuela, RBVietnamWorldYemen, Rep.ZambiaZimbabwe Timeline:
This timeline shows a graph from 1961 to 2014 of Middle income. No data until 1960. Number of actual observations by date: 54.
Source name:
World Development Indicators
Source organization:
IEA Statistics © OECD/IEA 2014 (http://www.iea.org/stats/index.asp), subject to https://www.iea.org/t&c/termsandconditions/
Categories, topics:
Environment
Last updated:
apr 23, 2017
Indicators value changes by year
Minimum:
13.915
jan 1, 1991
Maximum:
33.943
jan 1, 1962
At the date of observation
Value
Absolute change
Change from previous value
jan 1, 1961
32.916
+32.916
0.0%
jan 1, 1962
33.943
+1.027
3.12%
jan 1, 1963
33.028
-0.915
-2.7%
jan 1, 1964
31.789
-1.238
-3.75%
jan 1, 1965
32.059
+0.27
0.85%
jan 1, 1966
33.192
+1.133
3.53%
jan 1, 1967
32.807
-0.385
-1.16%
jan 1, 1968
30.494
-2.314
-7.05%
jan 1, 1969
29.57
-0.923
-3.03%
jan 1, 1970
26.682
-2.889
-9.77%
jan 1, 1971
26.977
+0.295
1.1%
jan 1, 1972
17.144
-9.832
-36.45%
jan 1, 1973
17.304
+0.16
0.93%
jan 1, 1974
17.519
+0.215
1.24%
jan 1, 1975
17.796
+0.277
1.58%
jan 1, 1976
17.369
-0.426
-2.39%
jan 1, 1977
17.229
-0.141
-0.81%
jan 1, 1978
16.751
-0.477
-2.77%
jan 1, 1979
16.528
-0.224
-1.33%
jan 1, 1980
16.5
-0.028
-0.17%
jan 1, 1981
16.677
+0.177
1.07%
jan 1, 1982
16.943
+0.266
1.59%
jan 1, 1983
16.592
-0.351
-2.07%
jan 1, 1984
16.147
-0.445
-2.68%
jan 1, 1985
15.682
-0.465
-2.88%
jan 1, 1986
15.773
+0.091
0.58%
jan 1, 1987
15.696
-0.078
-0.49%
jan 1, 1988
15.411
-0.285
-1.82%
jan 1, 1989
15.329
-0.082
-0.53%
jan 1, 1990
15.578
+0.249
1.62%
jan 1, 1991
13.915
-1.663
-10.67%
jan 1, 1992
14.186
+0.271
1.95%
jan 1, 1993
14.277
+0.091
0.64%
jan 1, 1994
14.189
-0.088
-0.61%
jan 1, 1995
14.096
-0.093
-0.66%
jan 1, 1996
14.035
-0.061
-0.43%
jan 1, 1997
14.96
+0.925
6.59%
jan 1, 1998
14.879
-0.081
-0.54%
jan 1, 1999
15.065
+0.186
1.25%
jan 1, 2000
15.411
+0.345
2.29%
jan 1, 2001
15.873
+0.462
3.0%
jan 1, 2002
15.951
+0.078
0.49%
jan 1, 2003
15.947
-0.004
-0.02%
jan 1, 2004
15.444
-0.503
-3.15%
jan 1, 2005
15.425
-0.02
-0.13%
jan 1, 2006
15.067
-0.358
-2.32%
jan 1, 2007
14.651
-0.416
-2.76%
jan 1, 2008
14.816
+0.166
1.13%
jan 1, 2009
15.176
+0.359
2.43%
jan 1, 2010
15.246
+0.07
0.46%
jan 1, 2011
15.515
+0.269
1.76%
jan 1, 2012
14.799
-0.715
-4.61%
jan 1, 2013
15.135
+0.335
2.26%
jan 1, 2014
15.122
-0.013
-0.09%
Ranking of countries by current statistics by years


Comments: