29
/
en
AIzaSyAYiBZKx7MnpbEhh9jyipgxe19OcubqV5w
April 1, 2024
56094
Small states
SST
false
2
1
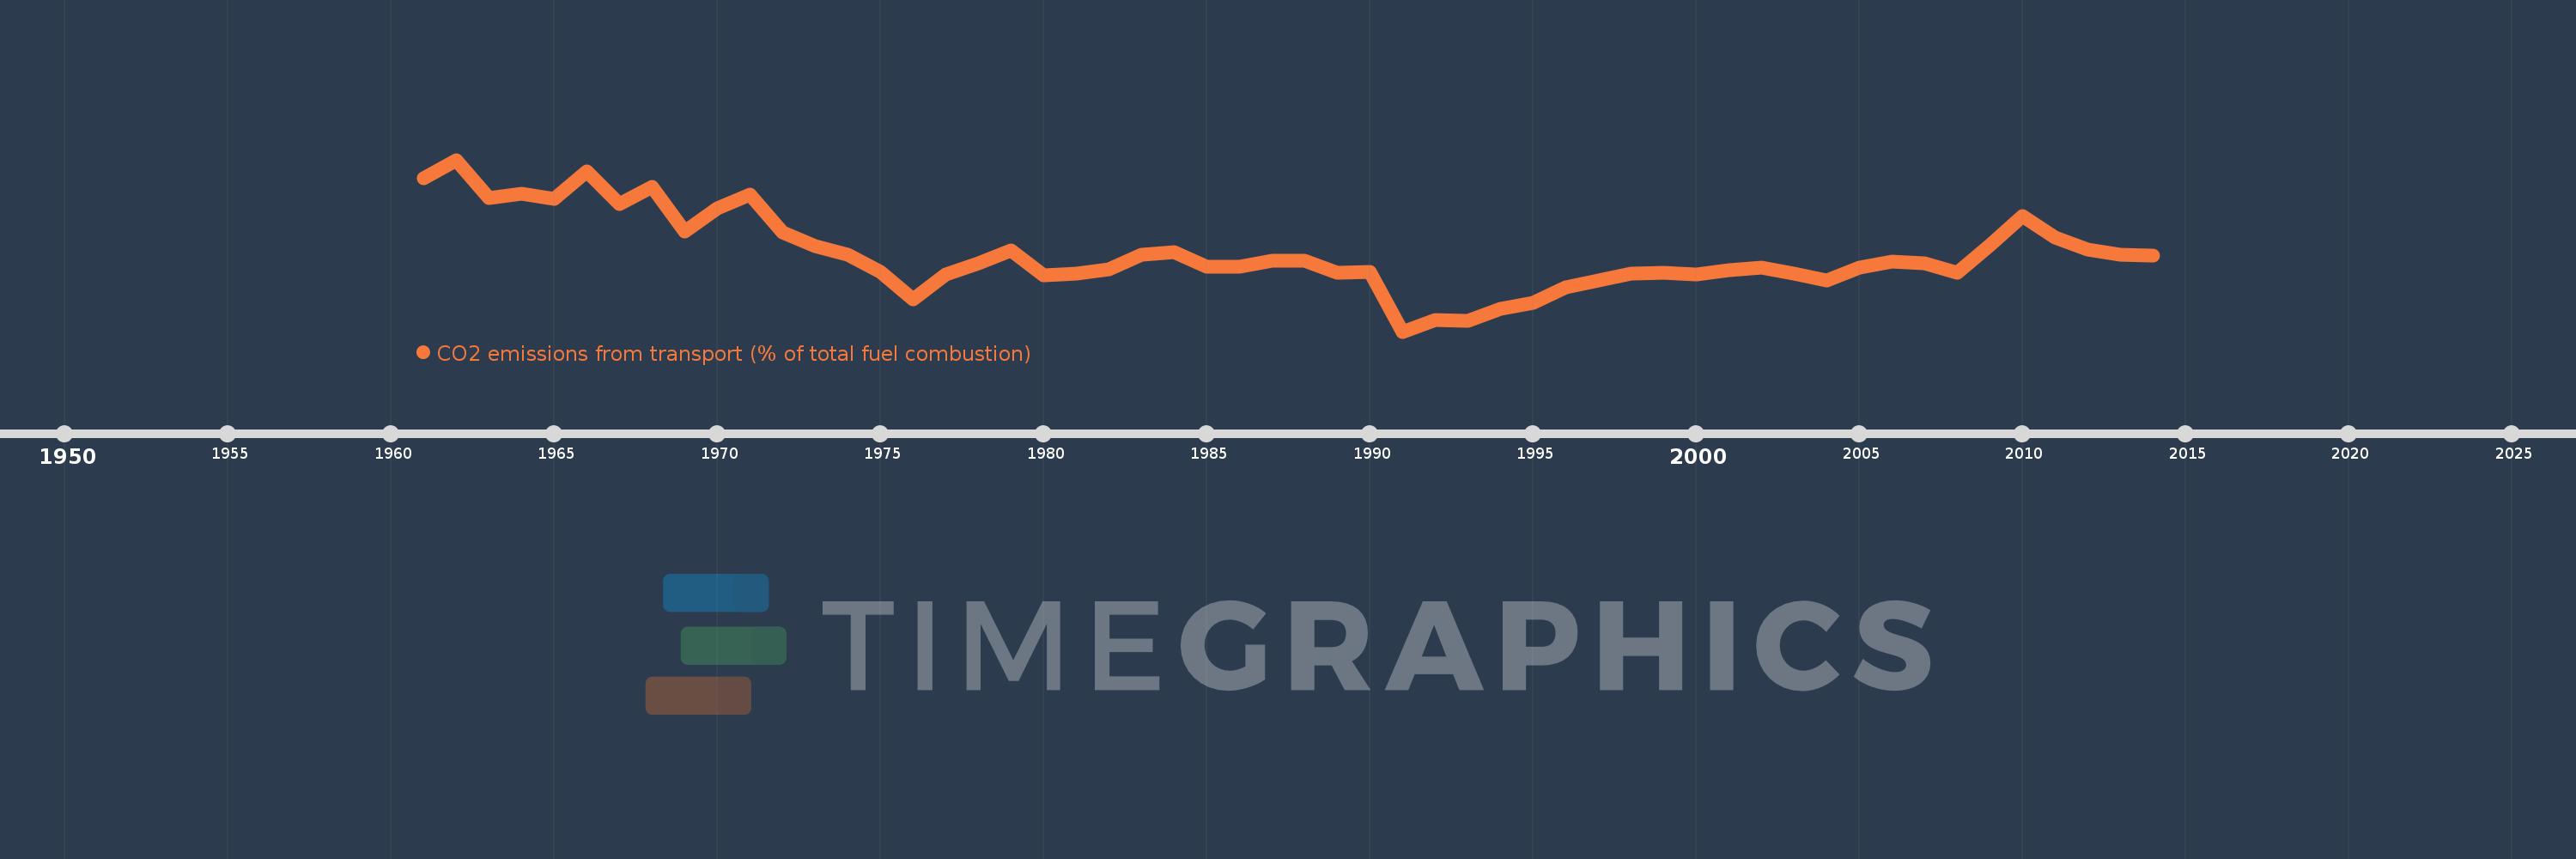
CO2 emissions from transport (% of total fuel combustion)
2014,2013,2012,2011,2010,2009,2008,2007,2006,2005,2004,2003,2002,2001,2000,1999,1998,1997,1996,1995,1994,1993,1992,1991,1990,1989,1988,1987,1986,1985,1984,1983,1982,1981,1980,1979,1978,1977,1976,1975,1974,1973,1972,1971,1970,1969,1968,1967,1966,1965,1964,1963,1962,1961
This statistics in other country:
AlbaniaAlgeriaAngolaArab WorldArgentinaArmeniaAustraliaAustriaAzerbaijanBahrainBangladeshBelarusBelgiumBeninBoliviaBosnia and HerzegovinaBotswanaBrazilBrunei DarussalamBulgariaCambodiaCameroonCanadaCaribbean small statesCentral Europe and the BalticsChileChinaColombiaCongo, Dem. Rep.Congo, Rep.Costa RicaCote d'IvoireCroatiaCubaCuracaoCyprusCzech RepublicDenmarkDominican RepublicEarly-demographic dividendEast Asia & PacificEast Asia & Pacific (excluding high income)East Asia & Pacific (IDA & IBRD countries)EcuadorEgypt, Arab Rep.El SalvadorEritreaEstoniaEthiopiaEuro areaEurope & Central AsiaEurope & Central Asia (excluding high income)Europe & Central Asia (IDA & IBRD countries)European UnionFinlandFragile and conflict affected situationsFranceGabonGeorgiaGermanyGhanaGibraltarGreeceGuatemalaHaitiHeavily indebted poor countries (HIPC)High incomeHondurasHong Kong SAR, ChinaHungaryIBRD onlyIcelandIDA & IBRD totalIDA blendIDA onlyIDA totalIndiaIndonesiaIran, Islamic Rep.IraqIrelandIsraelItalyJamaicaJapanJordanKazakhstanKenyaKorea, Dem. People’s Rep.Korea, Rep.KosovoKuwaitKyrgyz RepublicLate-demographic dividendLatin America & Caribbean Latin America & Caribbean (excluding high income)Latin America & the Caribbean (IDA & IBRD countries)LatviaLeast developed countries: UN classificationLebanonLibyaLithuaniaLow & middle incomeLow incomeLower middle incomeLuxembourgMacedonia, FYRMalaysiaMaltaMauritiusMexicoMiddle East & North AfricaMiddle East & North Africa (excluding high income)Middle East & North Africa (IDA & IBRD countries)Middle incomeMoldovaMongoliaMontenegroMoroccoMozambiqueMyanmarNamibiaNepalNetherlandsNew ZealandNicaraguaNigerNigeriaNorth AmericaNorwayOECD membersOmanOther small statesPakistanPanamaParaguayPeruPhilippinesPolandPortugalPost-demographic dividendPre-demographic dividendQatarRomaniaRussian FederationSaudi ArabiaSenegalSerbiaSingaporeSlovak RepublicSloveniaSmall statesSouth AfricaSouth AsiaSouth Asia (IDA & IBRD)South SudanSpainSri LankaSub-Saharan Africa Sub-Saharan Africa (excluding high income)Sub-Saharan Africa (IDA & IBRD countries)SudanSwedenSwitzerlandSyrian Arab RepublicTajikistanTanzaniaThailandTogoTrinidad and TobagoTunisiaTurkeyTurkmenistanUkraineUnited Arab EmiratesUnited KingdomUnited StatesUpper middle incomeUruguayUzbekistanVenezuela, RBVietnamWorldYemen, Rep.ZambiaZimbabwe Timeline:
This timeline shows a graph from 1961 to 2014 of Small states. No data until 1960. Number of actual observations by date: 54.
Source name:
World Development Indicators
Source organization:
IEA Statistics © OECD/IEA 2014 (http://www.iea.org/stats/index.asp), subject to https://www.iea.org/t&c/termsandconditions/
Categories, topics:
Environment
Last updated:
apr 23, 2017
Indicators value changes by year
Minimum:
12.669
jan 1, 1991
Maximum:
24.348
jan 1, 1962
At the date of observation
Value
Absolute change
Change from previous value
jan 1, 1961
23.077
+23.077
0.0%
jan 1, 1962
24.348
+1.271
5.51%
jan 1, 1963
21.774
-2.574
-10.57%
jan 1, 1964
22.047
+0.273
1.25%
jan 1, 1965
21.705
-0.342
-1.55%
jan 1, 1966
23.571
+1.866
8.6%
jan 1, 1967
21.333
-2.238
-9.49%
jan 1, 1968
22.535
+1.202
5.63%
jan 1, 1969
19.463
-3.072
-13.63%
jan 1, 1970
21.053
+1.59
8.17%
jan 1, 1971
21.97
+0.917
4.36%
jan 1, 1972
19.418
-2.552
-11.61%
jan 1, 1973
18.459
-0.959
-4.94%
jan 1, 1974
17.907
-0.552
-2.99%
jan 1, 1975
16.71
-1.197
-6.69%
jan 1, 1976
14.848
-1.862
-11.14%
jan 1, 1977
16.525
+1.677
11.29%
jan 1, 1978
17.291
+0.765
4.63%
jan 1, 1979
18.21
+0.919
5.32%
jan 1, 1980
16.506
-1.704
-9.36%
jan 1, 1981
16.594
+0.088
0.53%
jan 1, 1982
16.928
+0.333
2.01%
jan 1, 1983
17.919
+0.991
5.86%
jan 1, 1984
18.091
+0.173
0.96%
jan 1, 1985
17.092
-1.0
-5.52%
jan 1, 1986
17.055
-0.037
-0.22%
jan 1, 1987
17.509
+0.454
2.66%
jan 1, 1988
17.513
+0.004
0.02%
jan 1, 1989
16.683
-0.829
-4.74%
jan 1, 1990
16.746
+0.063
0.38%
jan 1, 1991
12.669
-4.077
-24.35%
jan 1, 1992
13.473
+0.804
6.35%
jan 1, 1993
13.418
-0.055
-0.41%
jan 1, 1994
14.241
+0.823
6.13%
jan 1, 1995
14.629
+0.388
2.73%
jan 1, 1996
15.695
+1.066
7.28%
jan 1, 1997
16.159
+0.464
2.96%
jan 1, 1998
16.608
+0.449
2.78%
jan 1, 1999
16.658
+0.05
0.3%
jan 1, 2000
16.577
-0.081
-0.49%
jan 1, 2001
16.829
+0.253
1.52%
jan 1, 2002
17.042
+0.213
1.26%
jan 1, 2003
16.607
-0.435
-2.55%
jan 1, 2004
16.146
-0.461
-2.78%
jan 1, 2005
17.009
+0.862
5.34%
jan 1, 2006
17.441
+0.433
2.54%
jan 1, 2007
17.296
-0.145
-0.83%
jan 1, 2008
16.693
-0.603
-3.49%
jan 1, 2009
18.523
+1.83
10.96%
jan 1, 2010
20.538
+2.015
10.88%
jan 1, 2011
19.05
-1.487
-7.24%
jan 1, 2012
18.257
-0.793
-4.16%
jan 1, 2013
17.879
-0.378
-2.07%
jan 1, 2014
17.857
-0.022
-0.12%
Ranking of countries by current statistics by years


Comments: