29
/
en
AIzaSyAYiBZKx7MnpbEhh9jyipgxe19OcubqV5w
April 1, 2024
36421
IBRD only
IBD
false
2
1
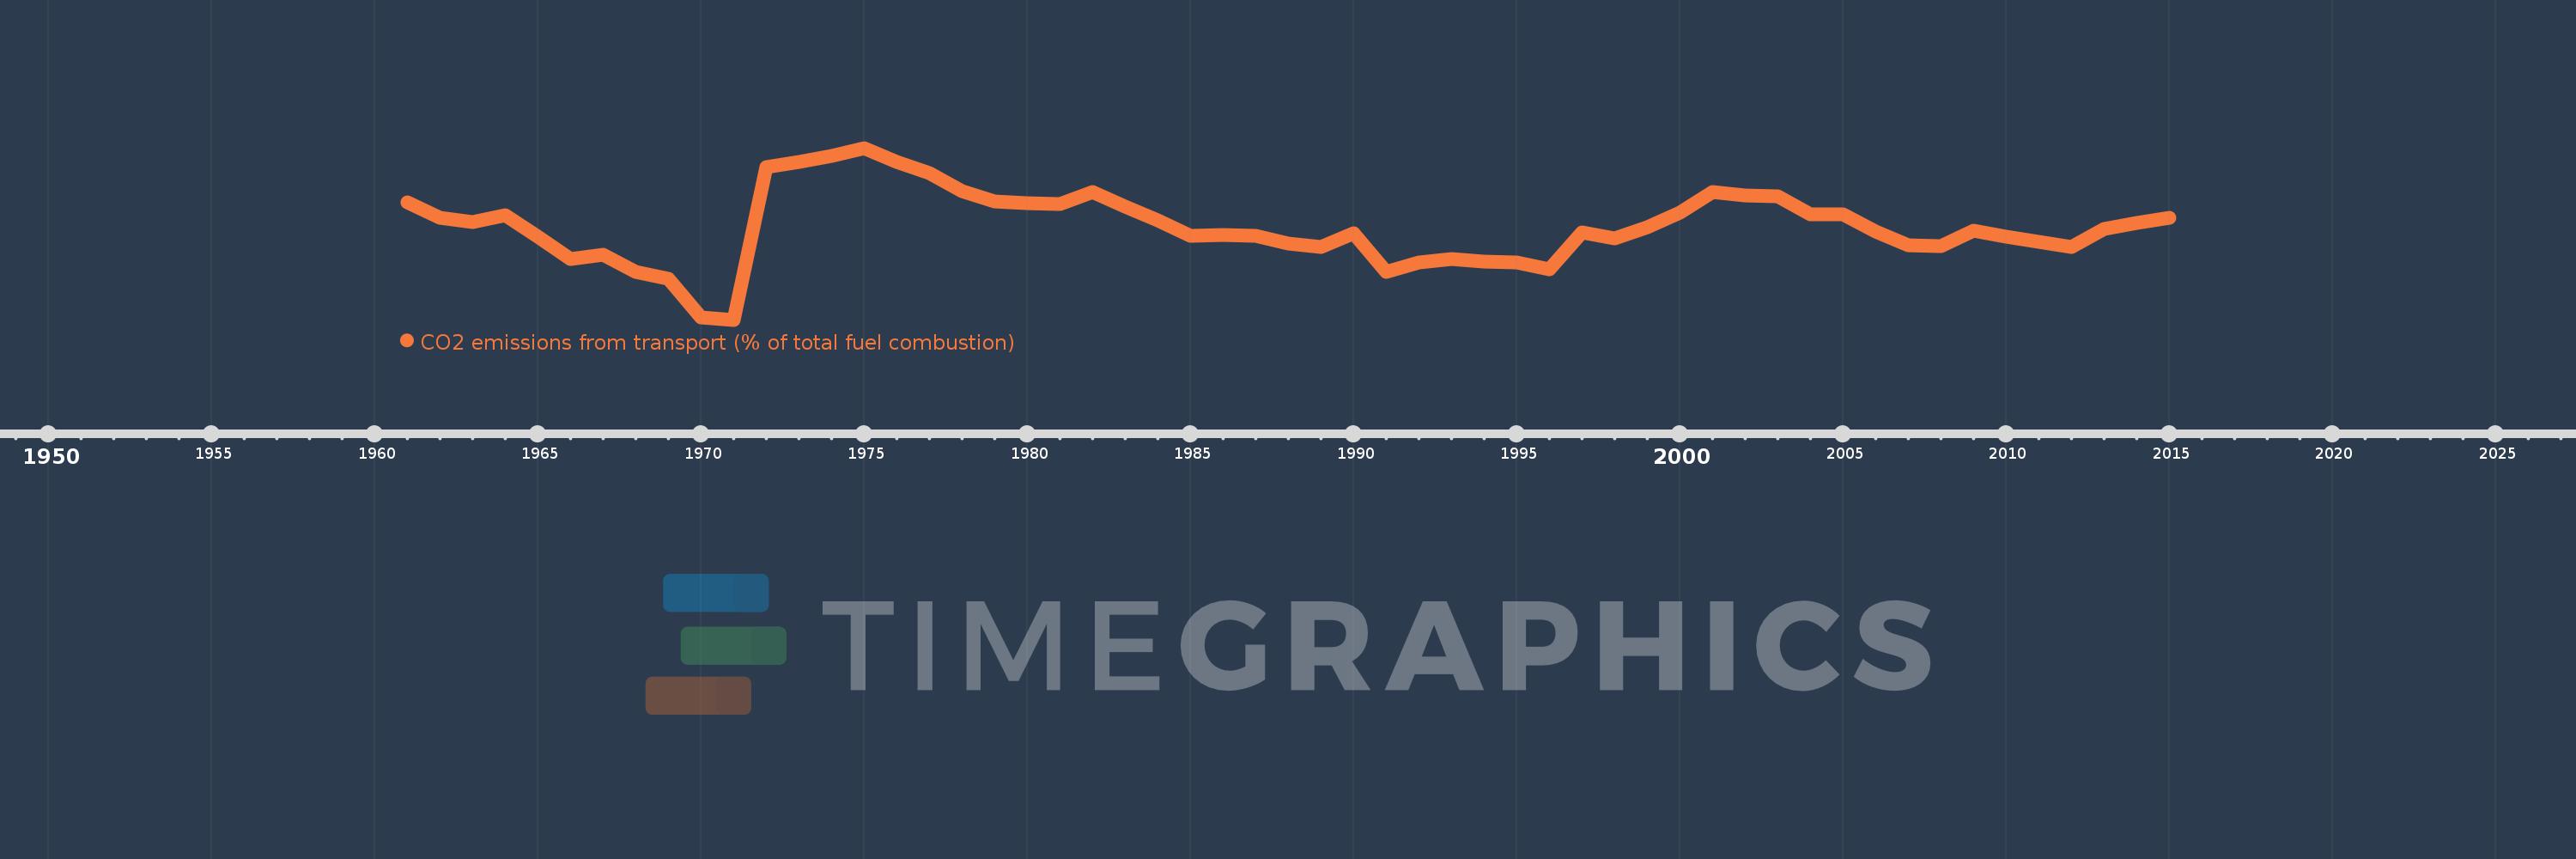
CO2 emissions from transport (% of total fuel combustion)
2015,2014,2013,2012,2011,2010,2009,2008,2007,2006,2005,2004,2003,2002,2001,2000,1999,1998,1997,1996,1995,1994,1993,1992,1991,1990,1989,1988,1987,1986,1985,1984,1983,1982,1981,1980,1979,1978,1977,1976,1975,1974,1973,1972,1971,1970,1969,1968,1967,1966,1965,1964,1963,1962,1961
This statistics in other country:
AlbaniaAlgeriaAngolaArab WorldArgentinaArmeniaAustraliaAustriaAzerbaijanBahrainBangladeshBelarusBelgiumBeninBoliviaBosnia and HerzegovinaBotswanaBrazilBrunei DarussalamBulgariaCambodiaCameroonCanadaCaribbean small statesCentral Europe and the BalticsChileChinaColombiaCongo, Dem. Rep.Congo, Rep.Costa RicaCote d'IvoireCroatiaCubaCuracaoCyprusCzech RepublicDenmarkDominican RepublicEarly-demographic dividendEast Asia & PacificEast Asia & Pacific (excluding high income)East Asia & Pacific (IDA & IBRD countries)EcuadorEgypt, Arab Rep.El SalvadorEritreaEstoniaEthiopiaEuro areaEurope & Central AsiaEurope & Central Asia (excluding high income)Europe & Central Asia (IDA & IBRD countries)European UnionFinlandFragile and conflict affected situationsFranceGabonGeorgiaGermanyGhanaGibraltarGreeceGuatemalaHaitiHeavily indebted poor countries (HIPC)High incomeHondurasHong Kong SAR, ChinaHungaryIBRD onlyIcelandIDA & IBRD totalIDA blendIDA onlyIDA totalIndiaIndonesiaIran, Islamic Rep.IraqIrelandIsraelItalyJamaicaJapanJordanKazakhstanKenyaKorea, Dem. People’s Rep.Korea, Rep.KosovoKuwaitKyrgyz RepublicLate-demographic dividendLatin America & Caribbean Latin America & Caribbean (excluding high income)Latin America & the Caribbean (IDA & IBRD countries)LatviaLeast developed countries: UN classificationLebanonLibyaLithuaniaLow & middle incomeLow incomeLower middle incomeLuxembourgMacedonia, FYRMalaysiaMaltaMauritiusMexicoMiddle East & North AfricaMiddle East & North Africa (excluding high income)Middle East & North Africa (IDA & IBRD countries)Middle incomeMoldovaMongoliaMontenegroMoroccoMozambiqueMyanmarNamibiaNepalNetherlandsNew ZealandNicaraguaNigerNigeriaNorth AmericaNorwayOECD membersOmanOther small statesPakistanPanamaParaguayPeruPhilippinesPolandPortugalPost-demographic dividendPre-demographic dividendQatarRomaniaRussian FederationSaudi ArabiaSenegalSerbiaSingaporeSlovak RepublicSloveniaSmall statesSouth AfricaSouth AsiaSouth Asia (IDA & IBRD)South SudanSpainSri LankaSub-Saharan Africa Sub-Saharan Africa (excluding high income)Sub-Saharan Africa (IDA & IBRD countries)SudanSwedenSwitzerlandSyrian Arab RepublicTajikistanTanzaniaThailandTogoTrinidad and TobagoTunisiaTurkeyTurkmenistanUkraineUnited Arab EmiratesUnited KingdomUnited StatesUpper middle incomeUruguayUzbekistanVenezuela, RBVietnamWorldYemen, Rep.ZambiaZimbabwe Timeline:
This timeline shows a graph from 1961 to 2015 of IBRD only. No data until 1960. Number of actual observations by date: 55.
Source name:
World Development Indicators
Source organization:
IEA Statistics © OECD/IEA 2014 (http://www.iea.org/stats/index.asp), subject to https://www.iea.org/t&c/termsandconditions/
Categories, topics:
Environment
Last updated:
apr 23, 2017
Indicators value changes by year
Minimum:
12.333
jan 1, 1971
Maximum:
16.704
jan 1, 1975
At the date of observation
Value
Absolute change
Change from previous value
jan 1, 1961
15.33
+15.33
0.0%
jan 1, 1962
14.922
-0.408
-2.66%
jan 1, 1963
14.824
-0.098
-0.66%
jan 1, 1964
14.984
+0.16
1.08%
jan 1, 1965
14.453
-0.531
-3.54%
jan 1, 1966
13.879
-0.574
-3.97%
jan 1, 1967
13.978
+0.099
0.71%
jan 1, 1968
13.555
-0.423
-3.03%
jan 1, 1969
13.386
-0.169
-1.24%
jan 1, 1970
12.388
-0.998
-7.46%
jan 1, 1971
12.333
-0.054
-0.44%
jan 1, 1972
16.217
+3.884
31.49%
jan 1, 1973
16.345
+0.128
0.79%
jan 1, 1974
16.511
+0.166
1.01%
jan 1, 1975
16.704
+0.193
1.17%
jan 1, 1976
16.358
-0.345
-2.07%
jan 1, 1977
16.066
-0.292
-1.79%
jan 1, 1978
15.612
-0.454
-2.83%
jan 1, 1979
15.352
-0.261
-1.67%
jan 1, 1980
15.303
-0.049
-0.32%
jan 1, 1981
15.275
-0.028
-0.18%
jan 1, 1982
15.586
+0.311
2.04%
jan 1, 1983
15.209
-0.378
-2.42%
jan 1, 1984
14.87
-0.339
-2.23%
jan 1, 1985
14.463
-0.407
-2.74%
jan 1, 1986
14.497
+0.035
0.24%
jan 1, 1987
14.477
-0.02
-0.14%
jan 1, 1988
14.272
-0.206
-1.42%
jan 1, 1989
14.182
-0.09
-0.63%
jan 1, 1990
14.523
+0.342
2.41%
jan 1, 1991
13.559
-0.965
-6.64%
jan 1, 1992
13.791
+0.232
1.71%
jan 1, 1993
13.886
+0.095
0.69%
jan 1, 1994
13.815
-0.071
-0.51%
jan 1, 1995
13.785
-0.029
-0.21%
jan 1, 1996
13.625
-0.161
-1.17%
jan 1, 1997
14.547
+0.923
6.77%
jan 1, 1998
14.393
-0.154
-1.06%
jan 1, 1999
14.683
+0.29
2.01%
jan 1, 2000
15.069
+0.386
2.63%
jan 1, 2001
15.584
+0.515
3.42%
jan 1, 2002
15.504
-0.08
-0.51%
jan 1, 2003
15.465
-0.039
-0.25%
jan 1, 2004
15.004
-0.461
-2.98%
jan 1, 2005
15.018
+0.014
0.09%
jan 1, 2006
14.588
-0.43
-2.86%
jan 1, 2007
14.237
-0.35
-2.4%
jan 1, 2008
14.203
-0.034
-0.24%
jan 1, 2009
14.602
+0.399
2.81%
jan 1, 2010
14.438
-0.164
-1.13%
jan 1, 2011
14.325
-0.112
-0.78%
jan 1, 2012
14.174
-0.152
-1.06%
jan 1, 2013
14.652
+0.478
3.37%
jan 1, 2014
14.789
+0.137
0.94%
jan 1, 2015
14.926
+0.137
0.93%
Ranking of countries by current statistics by years


Comments: