29
/
en
AIzaSyAYiBZKx7MnpbEhh9jyipgxe19OcubqV5w
April 1, 2024
42178
Latin America & Caribbean (excluding high income)
LAC
false
2
1
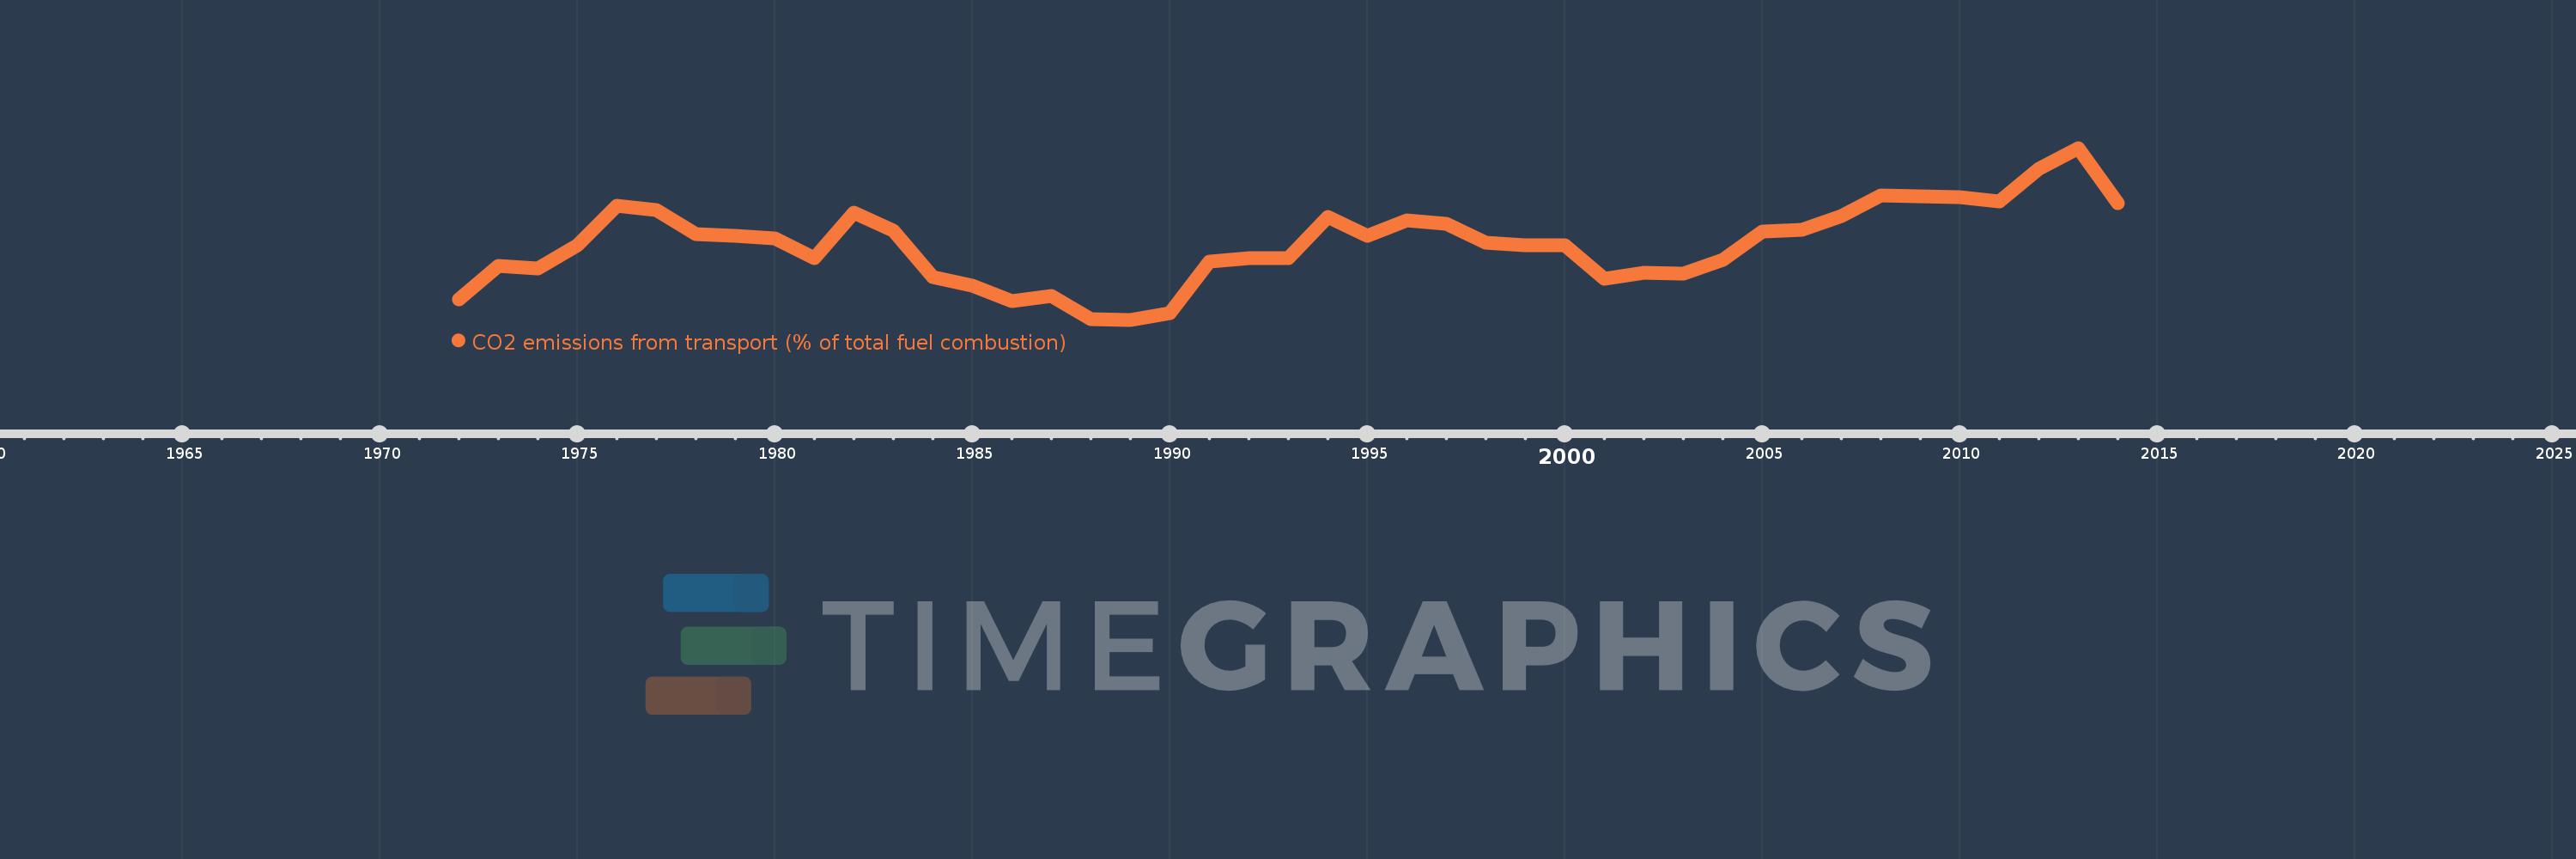
CO2 emissions from transport (% of total fuel combustion)
2014,2013,2012,2011,2010,2009,2008,2007,2006,2005,2004,2003,2002,2001,2000,1999,1998,1997,1996,1995,1994,1993,1992,1991,1990,1989,1988,1987,1986,1985,1984,1983,1982,1981,1980,1979,1978,1977,1976,1975,1974,1973,1972
This statistics in other country:
AlbaniaAlgeriaAngolaArab WorldArgentinaArmeniaAustraliaAustriaAzerbaijanBahrainBangladeshBelarusBelgiumBeninBoliviaBosnia and HerzegovinaBotswanaBrazilBrunei DarussalamBulgariaCambodiaCameroonCanadaCaribbean small statesCentral Europe and the BalticsChileChinaColombiaCongo, Dem. Rep.Congo, Rep.Costa RicaCote d'IvoireCroatiaCubaCuracaoCyprusCzech RepublicDenmarkDominican RepublicEarly-demographic dividendEast Asia & PacificEast Asia & Pacific (excluding high income)East Asia & Pacific (IDA & IBRD countries)EcuadorEgypt, Arab Rep.El SalvadorEritreaEstoniaEthiopiaEuro areaEurope & Central AsiaEurope & Central Asia (excluding high income)Europe & Central Asia (IDA & IBRD countries)European UnionFinlandFragile and conflict affected situationsFranceGabonGeorgiaGermanyGhanaGibraltarGreeceGuatemalaHaitiHeavily indebted poor countries (HIPC)High incomeHondurasHong Kong SAR, ChinaHungaryIBRD onlyIcelandIDA & IBRD totalIDA blendIDA onlyIDA totalIndiaIndonesiaIran, Islamic Rep.IraqIrelandIsraelItalyJamaicaJapanJordanKazakhstanKenyaKorea, Dem. People’s Rep.Korea, Rep.KosovoKuwaitKyrgyz RepublicLate-demographic dividendLatin America & Caribbean Latin America & Caribbean (excluding high income)Latin America & the Caribbean (IDA & IBRD countries)LatviaLeast developed countries: UN classificationLebanonLibyaLithuaniaLow & middle incomeLow incomeLower middle incomeLuxembourgMacedonia, FYRMalaysiaMaltaMauritiusMexicoMiddle East & North AfricaMiddle East & North Africa (excluding high income)Middle East & North Africa (IDA & IBRD countries)Middle incomeMoldovaMongoliaMontenegroMoroccoMozambiqueMyanmarNamibiaNepalNetherlandsNew ZealandNicaraguaNigerNigeriaNorth AmericaNorwayOECD membersOmanOther small statesPakistanPanamaParaguayPeruPhilippinesPolandPortugalPost-demographic dividendPre-demographic dividendQatarRomaniaRussian FederationSaudi ArabiaSenegalSerbiaSingaporeSlovak RepublicSloveniaSmall statesSouth AfricaSouth AsiaSouth Asia (IDA & IBRD)South SudanSpainSri LankaSub-Saharan Africa Sub-Saharan Africa (excluding high income)Sub-Saharan Africa (IDA & IBRD countries)SudanSwedenSwitzerlandSyrian Arab RepublicTajikistanTanzaniaThailandTogoTrinidad and TobagoTunisiaTurkeyTurkmenistanUkraineUnited Arab EmiratesUnited KingdomUnited StatesUpper middle incomeUruguayUzbekistanVenezuela, RBVietnamWorldYemen, Rep.ZambiaZimbabwe Timeline:
This timeline shows a graph from 1972 to 2014 of Latin America & Caribbean (excluding high income). No data until 1971. Number of actual observations by date: 43.
Source name:
World Development Indicators
Source organization:
IEA Statistics © OECD/IEA 2014 (http://www.iea.org/stats/index.asp), subject to https://www.iea.org/t&c/termsandconditions/
Categories, topics:
Environment
Last updated:
apr 23, 2017
Indicators value changes by year
Minimum:
33.412
jan 1, 1989
At the date of observation
Value
Absolute change
Change from previous value
jan 1, 1972
33.949
+33.949
0.0%
jan 1, 1973
34.852
+0.903
2.66%
jan 1, 1974
34.796
-0.057
-0.16%
jan 1, 1975
35.424
+0.628
1.8%
jan 1, 1976
36.475
+1.051
2.97%
jan 1, 1977
36.369
-0.106
-0.29%
jan 1, 1978
35.725
-0.644
-1.77%
jan 1, 1979
35.666
-0.059
-0.16%
jan 1, 1980
35.614
-0.052
-0.15%
jan 1, 1981
35.07
-0.544
-1.53%
jan 1, 1982
36.308
+1.239
3.53%
jan 1, 1983
35.815
-0.493
-1.36%
jan 1, 1984
34.551
-1.264
-3.53%
jan 1, 1985
34.329
-0.222
-0.64%
jan 1, 1986
33.906
-0.423
-1.23%
jan 1, 1987
34.044
+0.138
0.41%
jan 1, 1988
33.421
-0.622
-1.83%
jan 1, 1989
33.412
-0.009
-0.03%
jan 1, 1990
33.601
+0.188
0.56%
jan 1, 1991
34.971
+1.371
4.08%
jan 1, 1992
35.076
+0.105
0.3%
jan 1, 1993
35.074
-0.002
-0.01%
jan 1, 1994
36.184
+1.111
3.17%
jan 1, 1995
35.684
-0.5
-1.38%
jan 1, 1996
36.094
+0.41
1.15%
jan 1, 1997
35.996
-0.098
-0.27%
jan 1, 1998
35.496
-0.5
-1.39%
jan 1, 1999
35.428
-0.068
-0.19%
jan 1, 2000
35.408
-0.02
-0.06%
jan 1, 2001
34.52
-0.889
-2.51%
jan 1, 2002
34.684
+0.165
0.48%
jan 1, 2003
34.645
-0.039
-0.11%
jan 1, 2004
35.028
+0.383
1.11%
jan 1, 2005
35.798
+0.77
2.2%
jan 1, 2006
35.824
+0.026
0.07%
jan 1, 2007
36.207
+0.383
1.07%
jan 1, 2008
36.767
+0.56
1.55%
jan 1, 2009
36.735
-0.032
-0.09%
jan 1, 2010
36.715
-0.02
-0.05%
jan 1, 2011
36.603
-0.111
-0.3%
jan 1, 2012
37.487
+0.884
2.41%
jan 1, 2013
38.04
+0.553
1.48%
jan 1, 2014
36.55
-1.49
-3.92%
Ranking of countries by current statistics by years


Comments: