29
/
en
AIzaSyAYiBZKx7MnpbEhh9jyipgxe19OcubqV5w
April 1, 2024
148924
Haiti
HTI
true
2
1
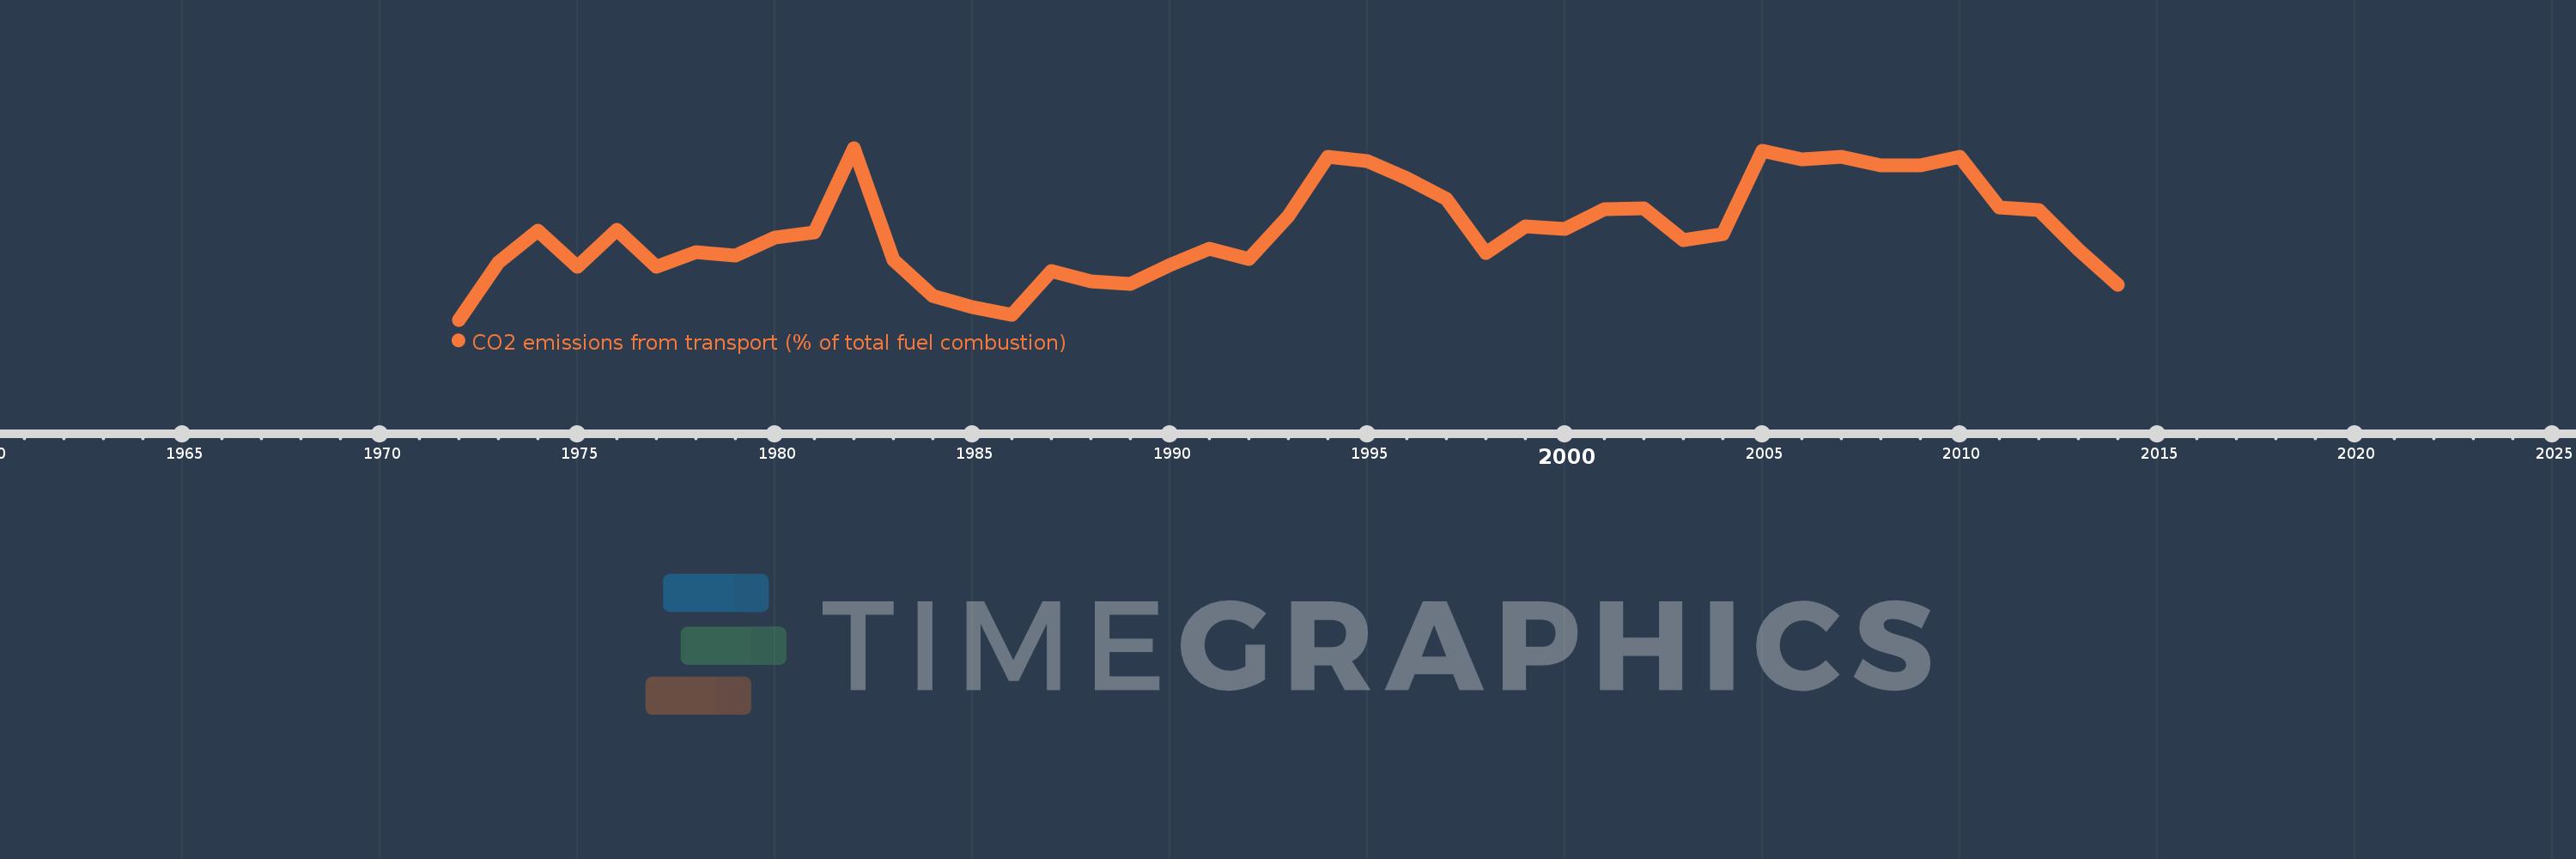
CO2 emissions from transport (% of total fuel combustion)
2014,2013,2012,2011,2010,2009,2008,2007,2006,2005,2004,2003,2002,2001,2000,1999,1998,1997,1996,1995,1994,1993,1992,1991,1990,1989,1988,1987,1986,1985,1984,1983,1982,1981,1980,1979,1978,1977,1976,1975,1974,1973,1972
This statistics in other country:
AlbaniaAlgeriaAngolaArab WorldArgentinaArmeniaAustraliaAustriaAzerbaijanBahrainBangladeshBelarusBelgiumBeninBoliviaBosnia and HerzegovinaBotswanaBrazilBrunei DarussalamBulgariaCambodiaCameroonCanadaCaribbean small statesCentral Europe and the BalticsChileChinaColombiaCongo, Dem. Rep.Congo, Rep.Costa RicaCote d'IvoireCroatiaCubaCuracaoCyprusCzech RepublicDenmarkDominican RepublicEarly-demographic dividendEast Asia & PacificEast Asia & Pacific (excluding high income)East Asia & Pacific (IDA & IBRD countries)EcuadorEgypt, Arab Rep.El SalvadorEritreaEstoniaEthiopiaEuro areaEurope & Central AsiaEurope & Central Asia (excluding high income)Europe & Central Asia (IDA & IBRD countries)European UnionFinlandFragile and conflict affected situationsFranceGabonGeorgiaGermanyGhanaGibraltarGreeceGuatemalaHaitiHeavily indebted poor countries (HIPC)High incomeHondurasHong Kong SAR, ChinaHungaryIBRD onlyIcelandIDA & IBRD totalIDA blendIDA onlyIDA totalIndiaIndonesiaIran, Islamic Rep.IraqIrelandIsraelItalyJamaicaJapanJordanKazakhstanKenyaKorea, Dem. People’s Rep.Korea, Rep.KosovoKuwaitKyrgyz RepublicLate-demographic dividendLatin America & Caribbean Latin America & Caribbean (excluding high income)Latin America & the Caribbean (IDA & IBRD countries)LatviaLeast developed countries: UN classificationLebanonLibyaLithuaniaLow & middle incomeLow incomeLower middle incomeLuxembourgMacedonia, FYRMalaysiaMaltaMauritiusMexicoMiddle East & North AfricaMiddle East & North Africa (excluding high income)Middle East & North Africa (IDA & IBRD countries)Middle incomeMoldovaMongoliaMontenegroMoroccoMozambiqueMyanmarNamibiaNepalNetherlandsNew ZealandNicaraguaNigerNigeriaNorth AmericaNorwayOECD membersOmanOther small statesPakistanPanamaParaguayPeruPhilippinesPolandPortugalPost-demographic dividendPre-demographic dividendQatarRomaniaRussian FederationSaudi ArabiaSenegalSerbiaSingaporeSlovak RepublicSloveniaSmall statesSouth AfricaSouth AsiaSouth Asia (IDA & IBRD)South SudanSpainSri LankaSub-Saharan Africa Sub-Saharan Africa (excluding high income)Sub-Saharan Africa (IDA & IBRD countries)SudanSwedenSwitzerlandSyrian Arab RepublicTajikistanTanzaniaThailandTogoTrinidad and TobagoTunisiaTurkeyTurkmenistanUkraineUnited Arab EmiratesUnited KingdomUnited StatesUpper middle incomeUruguayUzbekistanVenezuela, RBVietnamWorldYemen, Rep.ZambiaZimbabwe Timeline:
This timeline shows a graph from 1972 to 2014 of Haiti. No data until 1971. Number of actual observations by date: 43.
Source name:
World Development Indicators
Source organization:
IEA Statistics © OECD/IEA 2014 (http://www.iea.org/stats/index.asp), subject to https://www.iea.org/t&c/termsandconditions/
Categories, topics:
Environment
Last updated:
apr 23, 2017
Indicators value changes by year
Minimum:
36.842
jan 1, 1972
Maximum:
59.615
jan 1, 1982
At the date of observation
Value
Absolute change
Change from previous value
jan 1, 1972
36.842
+36.842
0.0%
jan 1, 1973
44.444
+7.602
20.63%
jan 1, 1974
48.649
+4.204
9.46%
jan 1, 1975
43.902
-4.746
-9.76%
jan 1, 1976
48.78
+4.878
11.11%
jan 1, 1977
43.86
-4.921
-10.09%
jan 1, 1978
45.763
+1.903
4.34%
jan 1, 1979
45.313
-0.45
-0.98%
jan 1, 1980
47.692
+2.38
5.25%
jan 1, 1981
48.387
+0.695
1.46%
jan 1, 1982
59.615
+11.228
23.21%
jan 1, 1983
44.776
-14.839
-24.89%
jan 1, 1984
40.0
-4.776
-10.67%
jan 1, 1985
38.462
-1.538
-3.85%
jan 1, 1986
37.5
-0.962
-2.5%
jan 1, 1987
43.243
+5.743
15.32%
jan 1, 1988
41.975
-1.268
-2.93%
jan 1, 1989
41.573
-0.402
-0.96%
jan 1, 1990
44.086
+2.513
6.04%
jan 1, 1991
46.237
+2.151
4.88%
jan 1, 1992
44.944
-1.293
-2.8%
jan 1, 1993
50.617
+5.673
12.62%
jan 1, 1994
58.462
+7.844
15.5%
jan 1, 1995
57.895
-0.567
-0.97%
jan 1, 1996
55.556
-2.339
-4.04%
jan 1, 1997
52.83
-2.725
-4.91%
jan 1, 1998
45.669
-7.161
-13.55%
jan 1, 1999
49.231
+3.561
7.8%
jan 1, 2000
48.889
-0.342
-0.69%
jan 1, 2001
51.449
+2.56
5.24%
jan 1, 2002
51.656
+0.206
0.4%
jan 1, 2003
47.399
-4.257
-8.24%
jan 1, 2004
48.171
+0.772
1.63%
jan 1, 2005
59.259
+11.089
23.02%
jan 1, 2006
58.081
-1.178
-1.99%
jan 1, 2007
58.416
+0.335
0.58%
jan 1, 2008
57.328
-1.088
-1.86%
jan 1, 2009
57.328
0.0
0.0%
jan 1, 2010
58.482
+1.155
2.01%
jan 1, 2011
51.675
-6.808
-11.64%
jan 1, 2012
51.402
-0.273
-0.53%
jan 1, 2013
46.154
-5.248
-10.21%
jan 1, 2014
41.475
-4.679
-10.14%
Ranking of countries by current statistics by years


Comments: