29
/
en
AIzaSyAYiBZKx7MnpbEhh9jyipgxe19OcubqV5w
April 1, 2024
41289
Latin America & Caribbean
LCN
false
2
1
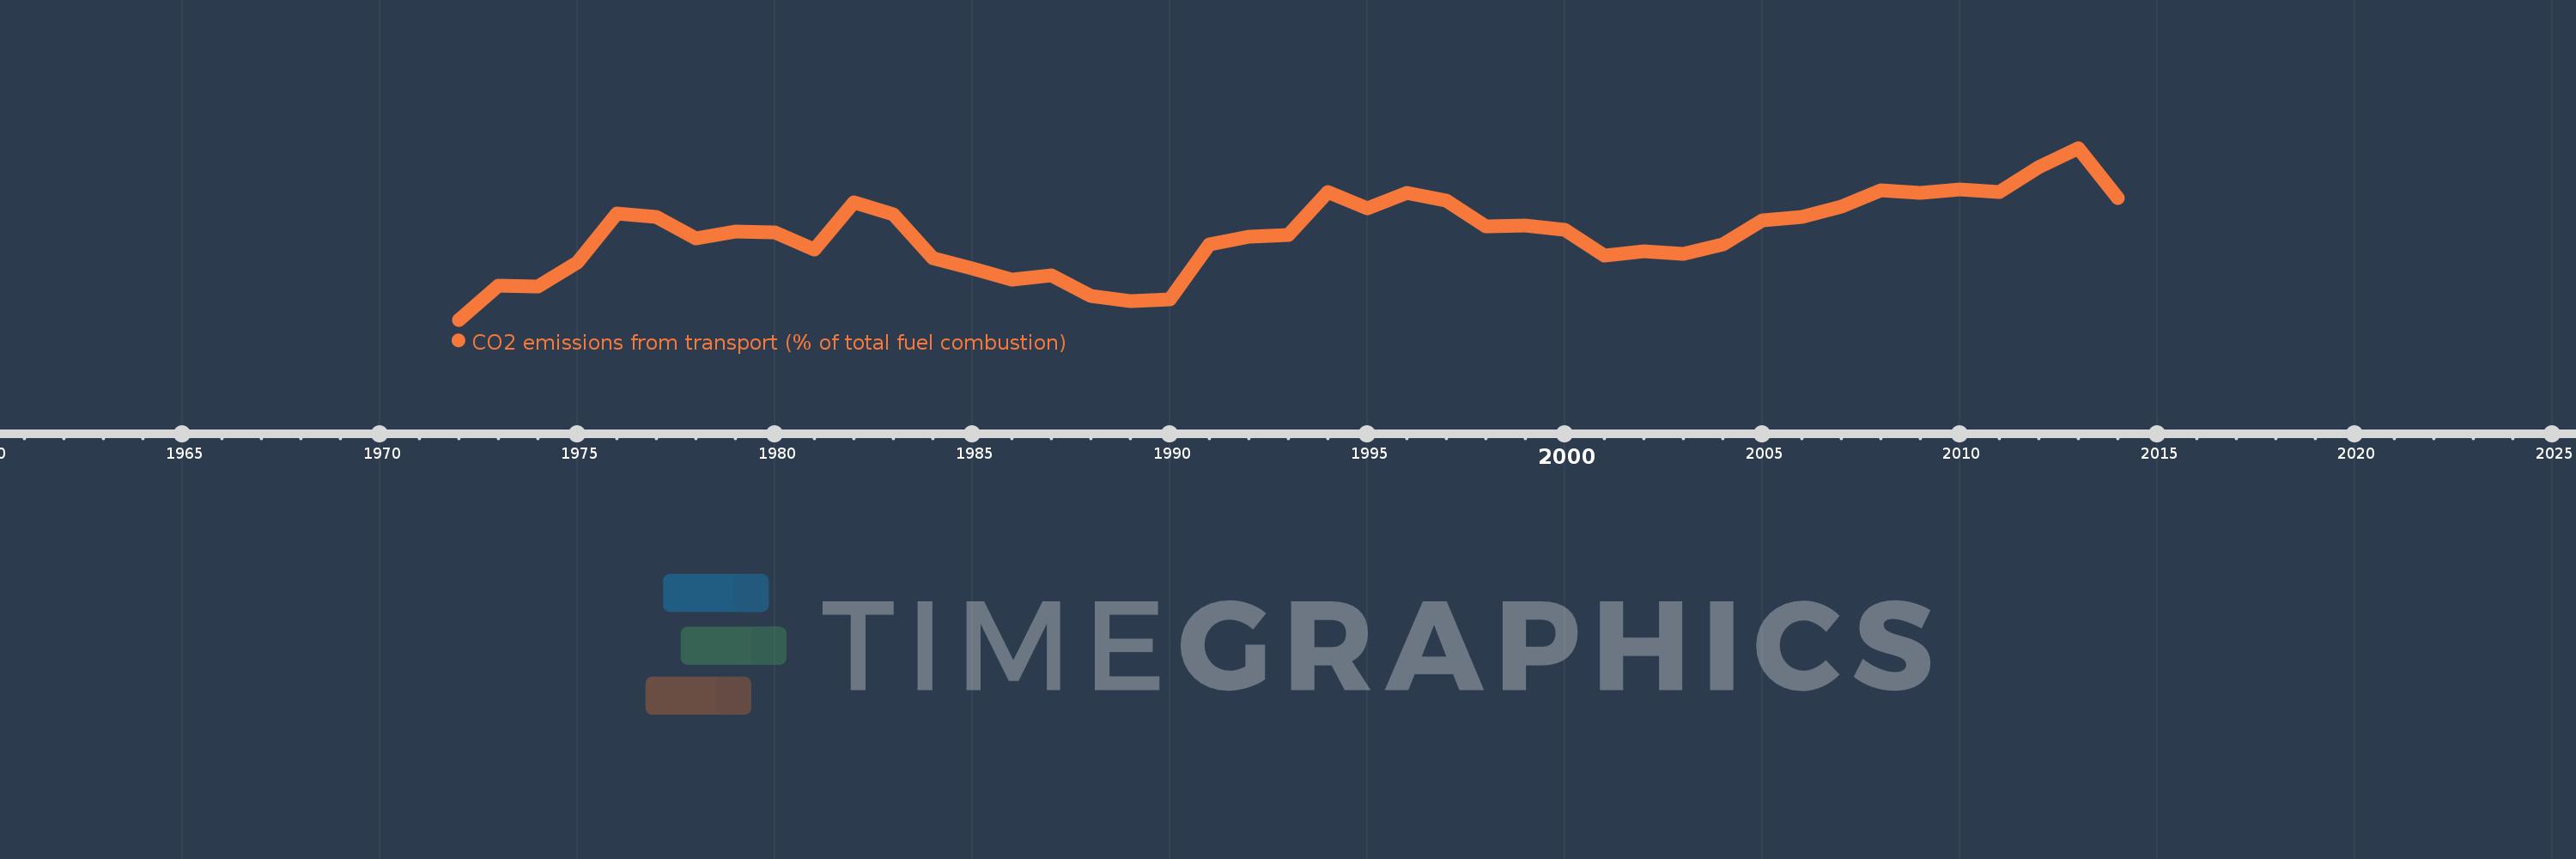
CO2 emissions from transport (% of total fuel combustion)
2014,2013,2012,2011,2010,2009,2008,2007,2006,2005,2004,2003,2002,2001,2000,1999,1998,1997,1996,1995,1994,1993,1992,1991,1990,1989,1988,1987,1986,1985,1984,1983,1982,1981,1980,1979,1978,1977,1976,1975,1974,1973,1972
This statistics in other country:
AlbaniaAlgeriaAngolaArab WorldArgentinaArmeniaAustraliaAustriaAzerbaijanBahrainBangladeshBelarusBelgiumBeninBoliviaBosnia and HerzegovinaBotswanaBrazilBrunei DarussalamBulgariaCambodiaCameroonCanadaCaribbean small statesCentral Europe and the BalticsChileChinaColombiaCongo, Dem. Rep.Congo, Rep.Costa RicaCote d'IvoireCroatiaCubaCuracaoCyprusCzech RepublicDenmarkDominican RepublicEarly-demographic dividendEast Asia & PacificEast Asia & Pacific (excluding high income)East Asia & Pacific (IDA & IBRD countries)EcuadorEgypt, Arab Rep.El SalvadorEritreaEstoniaEthiopiaEuro areaEurope & Central AsiaEurope & Central Asia (excluding high income)Europe & Central Asia (IDA & IBRD countries)European UnionFinlandFragile and conflict affected situationsFranceGabonGeorgiaGermanyGhanaGibraltarGreeceGuatemalaHaitiHeavily indebted poor countries (HIPC)High incomeHondurasHong Kong SAR, ChinaHungaryIBRD onlyIcelandIDA & IBRD totalIDA blendIDA onlyIDA totalIndiaIndonesiaIran, Islamic Rep.IraqIrelandIsraelItalyJamaicaJapanJordanKazakhstanKenyaKorea, Dem. People’s Rep.Korea, Rep.KosovoKuwaitKyrgyz RepublicLate-demographic dividendLatin America & Caribbean Latin America & Caribbean (excluding high income)Latin America & the Caribbean (IDA & IBRD countries)LatviaLeast developed countries: UN classificationLebanonLibyaLithuaniaLow & middle incomeLow incomeLower middle incomeLuxembourgMacedonia, FYRMalaysiaMaltaMauritiusMexicoMiddle East & North AfricaMiddle East & North Africa (excluding high income)Middle East & North Africa (IDA & IBRD countries)Middle incomeMoldovaMongoliaMontenegroMoroccoMozambiqueMyanmarNamibiaNepalNetherlandsNew ZealandNicaraguaNigerNigeriaNorth AmericaNorwayOECD membersOmanOther small statesPakistanPanamaParaguayPeruPhilippinesPolandPortugalPost-demographic dividendPre-demographic dividendQatarRomaniaRussian FederationSaudi ArabiaSenegalSerbiaSingaporeSlovak RepublicSloveniaSmall statesSouth AfricaSouth AsiaSouth Asia (IDA & IBRD)South SudanSpainSri LankaSub-Saharan Africa Sub-Saharan Africa (excluding high income)Sub-Saharan Africa (IDA & IBRD countries)SudanSwedenSwitzerlandSyrian Arab RepublicTajikistanTanzaniaThailandTogoTrinidad and TobagoTunisiaTurkeyTurkmenistanUkraineUnited Arab EmiratesUnited KingdomUnited StatesUpper middle incomeUruguayUzbekistanVenezuela, RBVietnamWorldYemen, Rep.ZambiaZimbabwe Timeline:
This timeline shows a graph from 1972 to 2014 of Latin America & Caribbean . No data until 1971. Number of actual observations by date: 43.
Source name:
World Development Indicators
Source organization:
IEA Statistics © OECD/IEA 2014 (http://www.iea.org/stats/index.asp), subject to https://www.iea.org/t&c/termsandconditions/
Categories, topics:
Environment
Last updated:
apr 23, 2017
Indicators value changes by year
Minimum:
32.679
jan 1, 1972
Maximum:
37.241
jan 1, 2013
At the date of observation
Value
Absolute change
Change from previous value
jan 1, 1972
32.679
+32.679
0.0%
jan 1, 1973
33.583
+0.905
2.77%
jan 1, 1974
33.559
-0.024
-0.07%
jan 1, 1975
34.208
+0.649
1.93%
jan 1, 1976
35.508
+1.3
3.8%
jan 1, 1977
35.406
-0.102
-0.29%
jan 1, 1978
34.834
-0.573
-1.62%
jan 1, 1979
35.025
+0.191
0.55%
jan 1, 1980
35.001
-0.024
-0.07%
jan 1, 1981
34.544
-0.456
-1.3%
jan 1, 1982
35.786
+1.241
3.59%
jan 1, 1983
35.468
-0.317
-0.89%
jan 1, 1984
34.314
-1.154
-3.25%
jan 1, 1985
34.045
-0.269
-0.79%
jan 1, 1986
33.746
-0.298
-0.88%
jan 1, 1987
33.865
+0.119
0.35%
jan 1, 1988
33.316
-0.549
-1.62%
jan 1, 1989
33.17
-0.146
-0.44%
jan 1, 1990
33.222
+0.052
0.16%
jan 1, 1991
34.683
+1.461
4.4%
jan 1, 1992
34.895
+0.212
0.61%
jan 1, 1993
34.934
+0.039
0.11%
jan 1, 1994
36.072
+1.139
3.26%
jan 1, 1995
35.641
-0.431
-1.19%
jan 1, 1996
36.038
+0.396
1.11%
jan 1, 1997
35.84
-0.198
-0.55%
jan 1, 1998
35.169
-0.67
-1.87%
jan 1, 1999
35.172
+0.002
0.01%
jan 1, 2000
35.071
-0.1
-0.29%
jan 1, 2001
34.385
-0.686
-1.96%
jan 1, 2002
34.488
+0.103
0.3%
jan 1, 2003
34.436
-0.052
-0.15%
jan 1, 2004
34.67
+0.235
0.68%
jan 1, 2005
35.31
+0.64
1.85%
jan 1, 2006
35.408
+0.098
0.28%
jan 1, 2007
35.691
+0.283
0.8%
jan 1, 2008
36.115
+0.424
1.19%
jan 1, 2009
36.058
-0.057
-0.16%
jan 1, 2010
36.15
+0.092
0.25%
jan 1, 2011
36.079
-0.071
-0.2%
jan 1, 2012
36.734
+0.655
1.82%
jan 1, 2013
37.241
+0.507
1.38%
jan 1, 2014
35.919
-1.322
-3.55%
Ranking of countries by current statistics by years


Comments: