29
/
en
AIzaSyAYiBZKx7MnpbEhh9jyipgxe19OcubqV5w
April 1, 2024
130208
Ethiopia
ETH
true
2
1
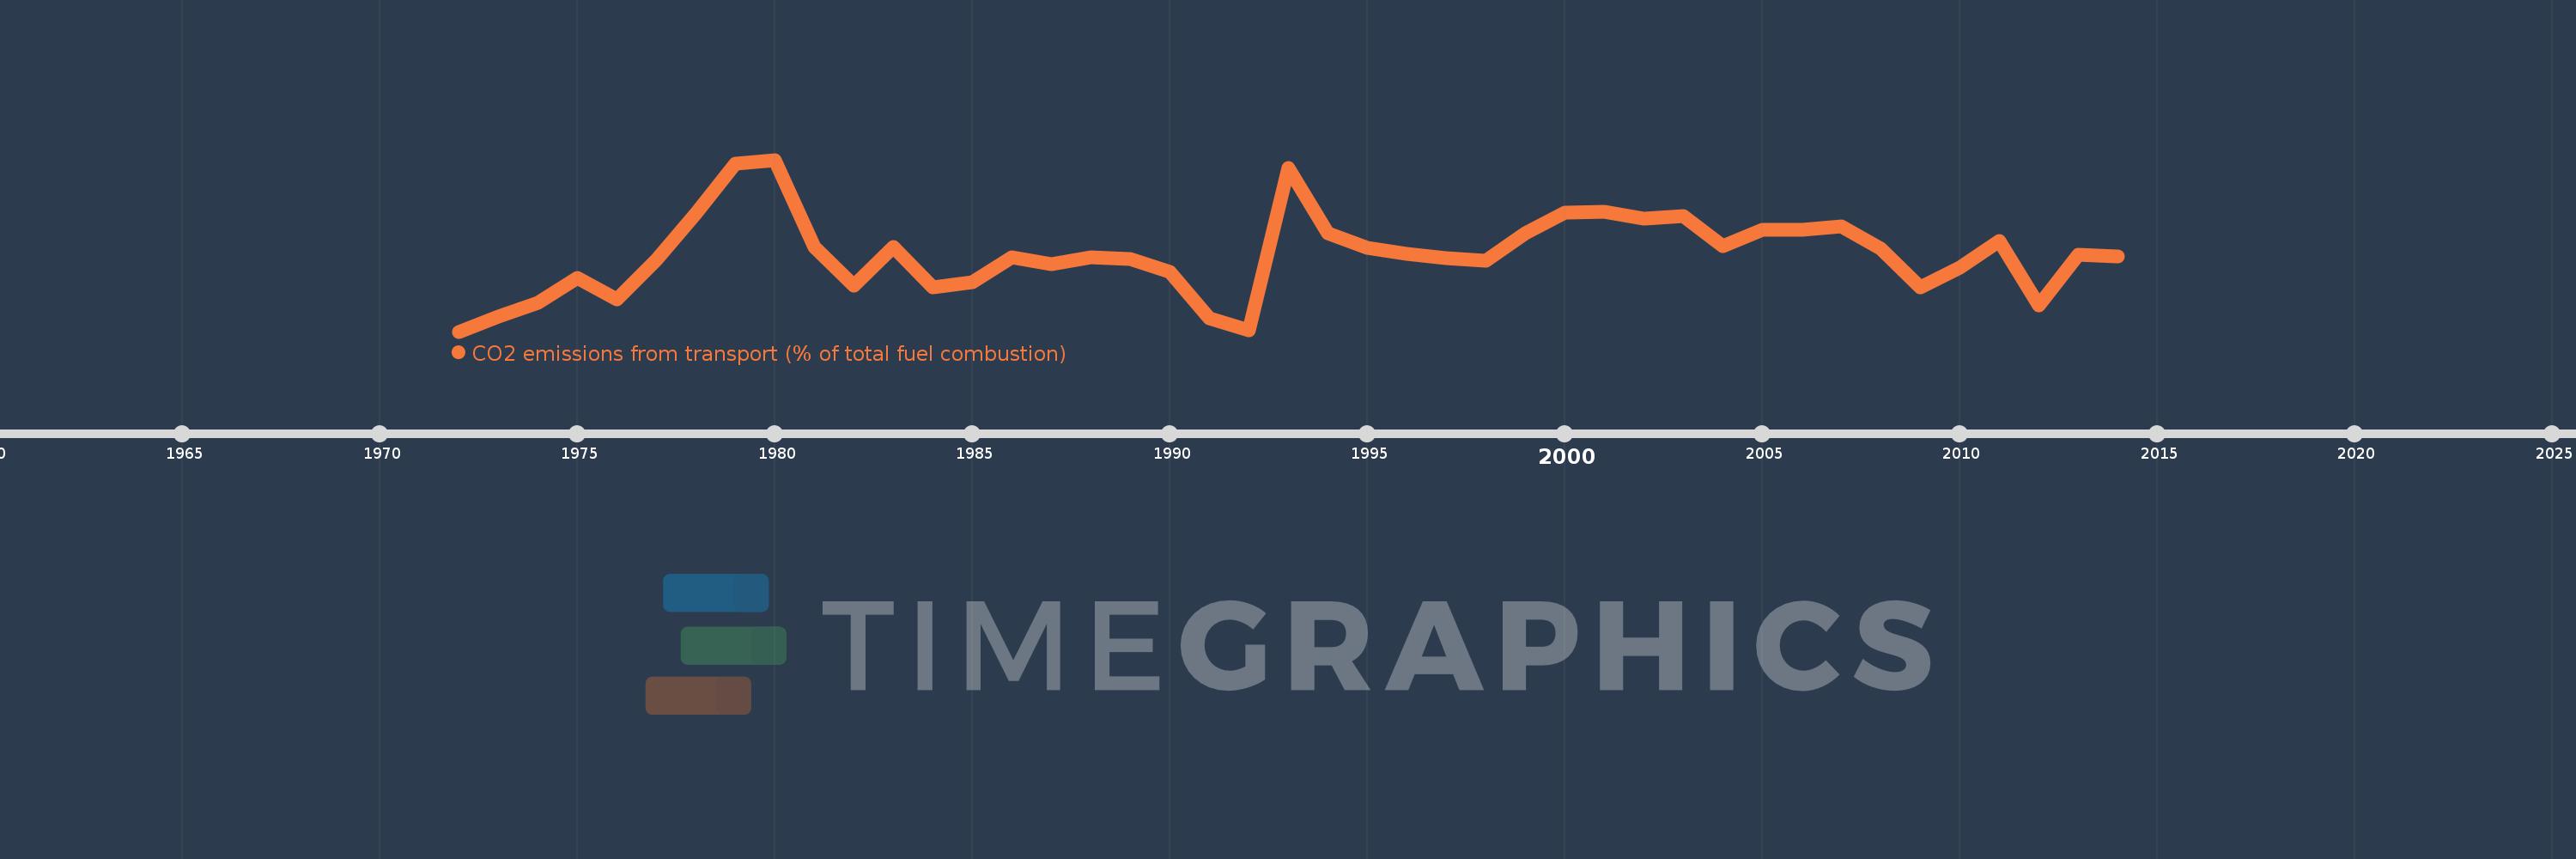
CO2 emissions from transport (% of total fuel combustion)
2014,2013,2012,2011,2010,2009,2008,2007,2006,2005,2004,2003,2002,2001,2000,1999,1998,1997,1996,1995,1994,1993,1992,1991,1990,1989,1988,1987,1986,1985,1984,1983,1982,1981,1980,1979,1978,1977,1976,1975,1974,1973,1972
This statistics in other country:
AlbaniaAlgeriaAngolaArab WorldArgentinaArmeniaAustraliaAustriaAzerbaijanBahrainBangladeshBelarusBelgiumBeninBoliviaBosnia and HerzegovinaBotswanaBrazilBrunei DarussalamBulgariaCambodiaCameroonCanadaCaribbean small statesCentral Europe and the BalticsChileChinaColombiaCongo, Dem. Rep.Congo, Rep.Costa RicaCote d'IvoireCroatiaCubaCuracaoCyprusCzech RepublicDenmarkDominican RepublicEarly-demographic dividendEast Asia & PacificEast Asia & Pacific (excluding high income)East Asia & Pacific (IDA & IBRD countries)EcuadorEgypt, Arab Rep.El SalvadorEritreaEstoniaEthiopiaEuro areaEurope & Central AsiaEurope & Central Asia (excluding high income)Europe & Central Asia (IDA & IBRD countries)European UnionFinlandFragile and conflict affected situationsFranceGabonGeorgiaGermanyGhanaGibraltarGreeceGuatemalaHaitiHeavily indebted poor countries (HIPC)High incomeHondurasHong Kong SAR, ChinaHungaryIBRD onlyIcelandIDA & IBRD totalIDA blendIDA onlyIDA totalIndiaIndonesiaIran, Islamic Rep.IraqIrelandIsraelItalyJamaicaJapanJordanKazakhstanKenyaKorea, Dem. People’s Rep.Korea, Rep.KosovoKuwaitKyrgyz RepublicLate-demographic dividendLatin America & Caribbean Latin America & Caribbean (excluding high income)Latin America & the Caribbean (IDA & IBRD countries)LatviaLeast developed countries: UN classificationLebanonLibyaLithuaniaLow & middle incomeLow incomeLower middle incomeLuxembourgMacedonia, FYRMalaysiaMaltaMauritiusMexicoMiddle East & North AfricaMiddle East & North Africa (excluding high income)Middle East & North Africa (IDA & IBRD countries)Middle incomeMoldovaMongoliaMontenegroMoroccoMozambiqueMyanmarNamibiaNepalNetherlandsNew ZealandNicaraguaNigerNigeriaNorth AmericaNorwayOECD membersOmanOther small statesPakistanPanamaParaguayPeruPhilippinesPolandPortugalPost-demographic dividendPre-demographic dividendQatarRomaniaRussian FederationSaudi ArabiaSenegalSerbiaSingaporeSlovak RepublicSloveniaSmall statesSouth AfricaSouth AsiaSouth Asia (IDA & IBRD)South SudanSpainSri LankaSub-Saharan Africa Sub-Saharan Africa (excluding high income)Sub-Saharan Africa (IDA & IBRD countries)SudanSwedenSwitzerlandSyrian Arab RepublicTajikistanTanzaniaThailandTogoTrinidad and TobagoTunisiaTurkeyTurkmenistanUkraineUnited Arab EmiratesUnited KingdomUnited StatesUpper middle incomeUruguayUzbekistanVenezuela, RBVietnamWorldYemen, Rep.ZambiaZimbabwe Timeline:
This timeline shows a graph from 1972 to 2014 of Ethiopia. No data until 1971. Number of actual observations by date: 43.
Source name:
World Development Indicators
Source organization:
IEA Statistics © OECD/IEA 2014 (http://www.iea.org/stats/index.asp), subject to https://www.iea.org/t&c/termsandconditions/
Categories, topics:
Environment
Last updated:
apr 23, 2017
Indicators value changes by year
Minimum:
41.985
jan 1, 1972
At the date of observation
Value
Absolute change
Change from previous value
jan 1, 1972
41.985
+41.985
0.0%
jan 1, 1973
42.975
+0.99
2.36%
jan 1, 1974
43.846
+0.871
2.03%
jan 1, 1975
45.455
+1.608
3.67%
jan 1, 1976
44.068
-1.387
-3.05%
jan 1, 1977
46.61
+2.542
5.77%
jan 1, 1978
49.573
+2.962
6.36%
jan 1, 1979
52.8
+3.227
6.51%
jan 1, 1980
53.03
+0.23
0.44%
jan 1, 1981
47.407
-5.623
-10.6%
jan 1, 1982
44.966
-2.441
-5.15%
jan 1, 1983
47.407
+2.441
5.43%
jan 1, 1984
44.828
-2.58
-5.44%
jan 1, 1985
45.185
+0.358
0.8%
jan 1, 1986
46.763
+1.577
3.49%
jan 1, 1987
46.341
-0.421
-0.9%
jan 1, 1988
46.774
+0.433
0.93%
jan 1, 1989
46.632
-0.142
-0.3%
jan 1, 1990
45.813
-0.819
-1.76%
jan 1, 1991
42.857
-2.956
-6.45%
jan 1, 1992
42.081
-0.776
-1.81%
jan 1, 1993
52.518
+10.437
24.8%
jan 1, 1994
48.333
-4.185
-7.97%
jan 1, 1995
47.343
-0.99
-2.05%
jan 1, 1996
46.983
-0.36
-0.76%
jan 1, 1997
46.718
-0.265
-0.56%
jan 1, 1998
46.545
-0.173
-0.37%
jan 1, 1999
48.288
+1.742
3.74%
jan 1, 2000
49.658
+1.37
2.84%
jan 1, 2001
49.688
+0.03
0.06%
jan 1, 2002
49.257
-0.43
-0.87%
jan 1, 2003
49.406
+0.149
0.3%
jan 1, 2004
47.484
-1.923
-3.89%
jan 1, 2005
48.542
+1.058
2.23%
jan 1, 2006
48.552
+0.011
0.02%
jan 1, 2007
48.75
+0.198
0.41%
jan 1, 2008
47.31
-1.44
-2.95%
jan 1, 2009
44.804
-2.506
-5.3%
jan 1, 2010
46.077
+1.273
2.84%
jan 1, 2011
47.819
+1.742
3.78%
jan 1, 2012
43.668
-4.151
-8.68%
jan 1, 2013
46.905
+3.237
7.41%
jan 1, 2014
46.824
-0.082
-0.17%
Ranking of countries by current statistics by years


Comments: