29
/
en
AIzaSyAYiBZKx7MnpbEhh9jyipgxe19OcubqV5w
April 1, 2024
110699
Congo, Rep.
COG
true
2
1
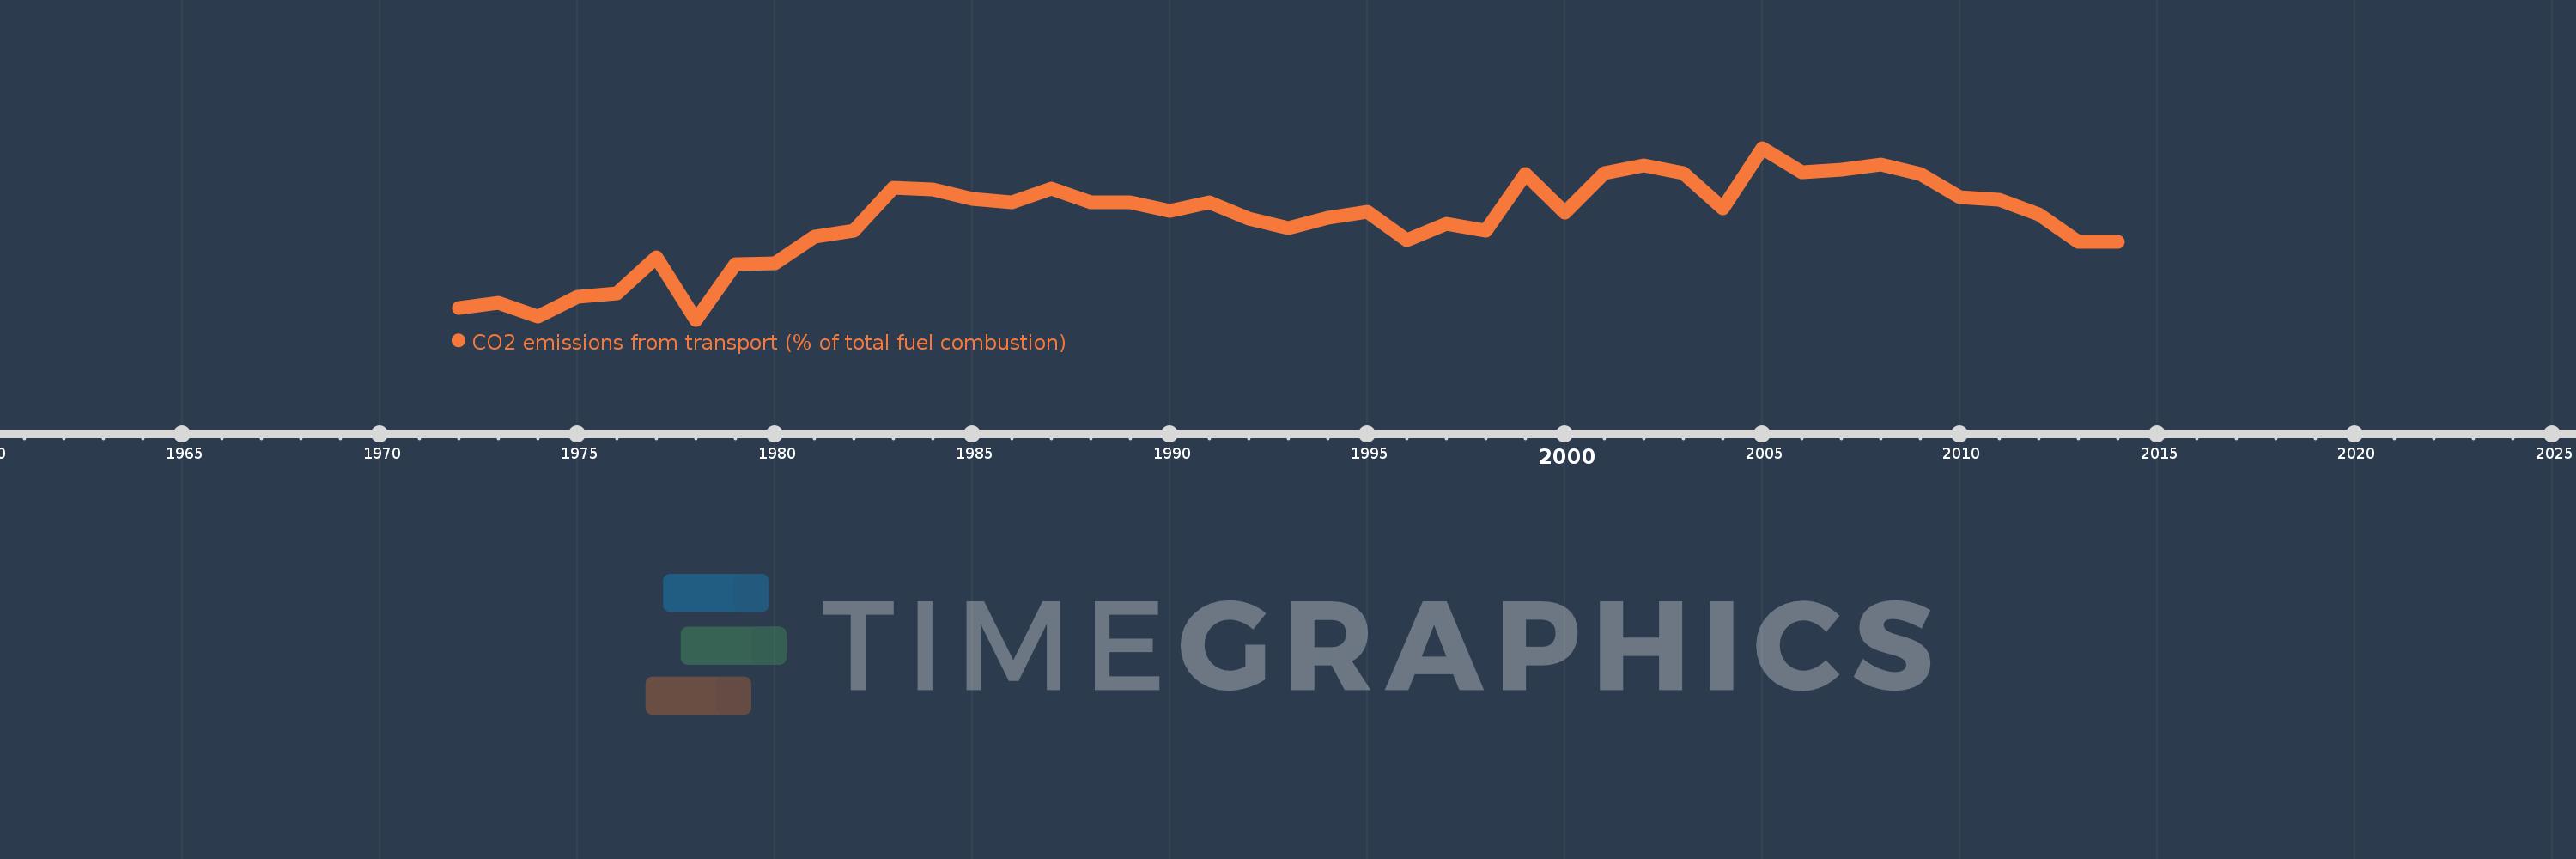
CO2 emissions from transport (% of total fuel combustion)
2014,2013,2012,2011,2010,2009,2008,2007,2006,2005,2004,2003,2002,2001,2000,1999,1998,1997,1996,1995,1994,1993,1992,1991,1990,1989,1988,1987,1986,1985,1984,1983,1982,1981,1980,1979,1978,1977,1976,1975,1974,1973,1972
This statistics in other country:
AlbaniaAlgeriaAngolaArab WorldArgentinaArmeniaAustraliaAustriaAzerbaijanBahrainBangladeshBelarusBelgiumBeninBoliviaBosnia and HerzegovinaBotswanaBrazilBrunei DarussalamBulgariaCambodiaCameroonCanadaCaribbean small statesCentral Europe and the BalticsChileChinaColombiaCongo, Dem. Rep.Congo, Rep.Costa RicaCote d'IvoireCroatiaCubaCuracaoCyprusCzech RepublicDenmarkDominican RepublicEarly-demographic dividendEast Asia & PacificEast Asia & Pacific (excluding high income)East Asia & Pacific (IDA & IBRD countries)EcuadorEgypt, Arab Rep.El SalvadorEritreaEstoniaEthiopiaEuro areaEurope & Central AsiaEurope & Central Asia (excluding high income)Europe & Central Asia (IDA & IBRD countries)European UnionFinlandFragile and conflict affected situationsFranceGabonGeorgiaGermanyGhanaGibraltarGreeceGuatemalaHaitiHeavily indebted poor countries (HIPC)High incomeHondurasHong Kong SAR, ChinaHungaryIBRD onlyIcelandIDA & IBRD totalIDA blendIDA onlyIDA totalIndiaIndonesiaIran, Islamic Rep.IraqIrelandIsraelItalyJamaicaJapanJordanKazakhstanKenyaKorea, Dem. People’s Rep.Korea, Rep.KosovoKuwaitKyrgyz RepublicLate-demographic dividendLatin America & Caribbean Latin America & Caribbean (excluding high income)Latin America & the Caribbean (IDA & IBRD countries)LatviaLeast developed countries: UN classificationLebanonLibyaLithuaniaLow & middle incomeLow incomeLower middle incomeLuxembourgMacedonia, FYRMalaysiaMaltaMauritiusMexicoMiddle East & North AfricaMiddle East & North Africa (excluding high income)Middle East & North Africa (IDA & IBRD countries)Middle incomeMoldovaMongoliaMontenegroMoroccoMozambiqueMyanmarNamibiaNepalNetherlandsNew ZealandNicaraguaNigerNigeriaNorth AmericaNorwayOECD membersOmanOther small statesPakistanPanamaParaguayPeruPhilippinesPolandPortugalPost-demographic dividendPre-demographic dividendQatarRomaniaRussian FederationSaudi ArabiaSenegalSerbiaSingaporeSlovak RepublicSloveniaSmall statesSouth AfricaSouth AsiaSouth Asia (IDA & IBRD)South SudanSpainSri LankaSub-Saharan Africa Sub-Saharan Africa (excluding high income)Sub-Saharan Africa (IDA & IBRD countries)SudanSwedenSwitzerlandSyrian Arab RepublicTajikistanTanzaniaThailandTogoTrinidad and TobagoTunisiaTurkeyTurkmenistanUkraineUnited Arab EmiratesUnited KingdomUnited StatesUpper middle incomeUruguayUzbekistanVenezuela, RBVietnamWorldYemen, Rep.ZambiaZimbabwe Timeline:
This timeline shows a graph from 1972 to 2014 of Congo, Rep.. No data until 1971. Number of actual observations by date: 43.
Source name:
World Development Indicators
Source organization:
IEA Statistics © OECD/IEA 2014 (http://www.iea.org/stats/index.asp), subject to https://www.iea.org/t&c/termsandconditions/
Categories, topics:
Environment
Last updated:
apr 23, 2017
Indicators value changes by year
Minimum:
59.375
jan 1, 1978
Maximum:
89.474
jan 1, 2005
At the date of observation
Value
Absolute change
Change from previous value
jan 1, 1972
61.404
+61.404
0.0%
jan 1, 1973
62.295
+0.892
1.45%
jan 1, 1974
60.0
-2.295
-3.68%
jan 1, 1975
63.333
+3.333
5.56%
jan 1, 1976
63.934
+0.601
0.95%
jan 1, 1977
70.27
+6.336
9.91%
jan 1, 1978
59.375
-10.895
-15.5%
jan 1, 1979
69.118
+9.743
16.41%
jan 1, 1980
69.231
+0.113
0.16%
jan 1, 1981
73.913
+4.682
6.76%
jan 1, 1982
75.0
+1.087
1.47%
jan 1, 1983
82.5
+7.5
10.0%
jan 1, 1984
82.278
-0.222
-0.27%
jan 1, 1985
80.556
-1.723
-2.09%
jan 1, 1986
80.0
-0.556
-0.69%
jan 1, 1987
82.353
+2.353
2.94%
jan 1, 1988
80.0
-2.353
-2.86%
jan 1, 1990
78.462
-1.538
-1.92%
jan 1, 1991
80.0
+1.538
1.96%
jan 1, 1992
77.049
-2.951
-3.69%
jan 1, 1993
75.439
-1.611
-2.09%
jan 1, 1994
77.193
+1.754
2.33%
jan 1, 1995
78.261
+1.068
1.38%
jan 1, 1996
73.333
-4.928
-6.3%
jan 1, 1997
76.19
+2.857
3.9%
jan 1, 1998
75.0
-1.19
-1.56%
jan 1, 1999
84.848
+9.848
13.13%
jan 1, 2000
78.125
-6.723
-7.92%
jan 1, 2001
85.106
+6.981
8.94%
jan 1, 2002
86.441
+1.334
1.57%
jan 1, 2003
85.106
-1.334
-1.54%
jan 1, 2004
78.873
-6.233
-7.32%
jan 1, 2005
89.474
+10.6
13.44%
jan 1, 2006
85.185
-4.288
-4.79%
jan 1, 2007
85.714
+0.529
0.62%
jan 1, 2008
86.538
+0.824
0.96%
jan 1, 2009
84.848
-1.69
-1.95%
jan 1, 2010
80.795
-4.054
-4.78%
jan 1, 2011
80.337
-0.458
-0.57%
jan 1, 2012
77.833
-2.505
-3.12%
jan 1, 2013
73.009
-4.824
-6.2%
jan 1, 2014
73.077
+0.068
0.09%
Ranking of countries by current statistics by years


Comments: