29
/
en
AIzaSyAYiBZKx7MnpbEhh9jyipgxe19OcubqV5w
April 1, 2024
223312
Philippines
PHL
true
2
1
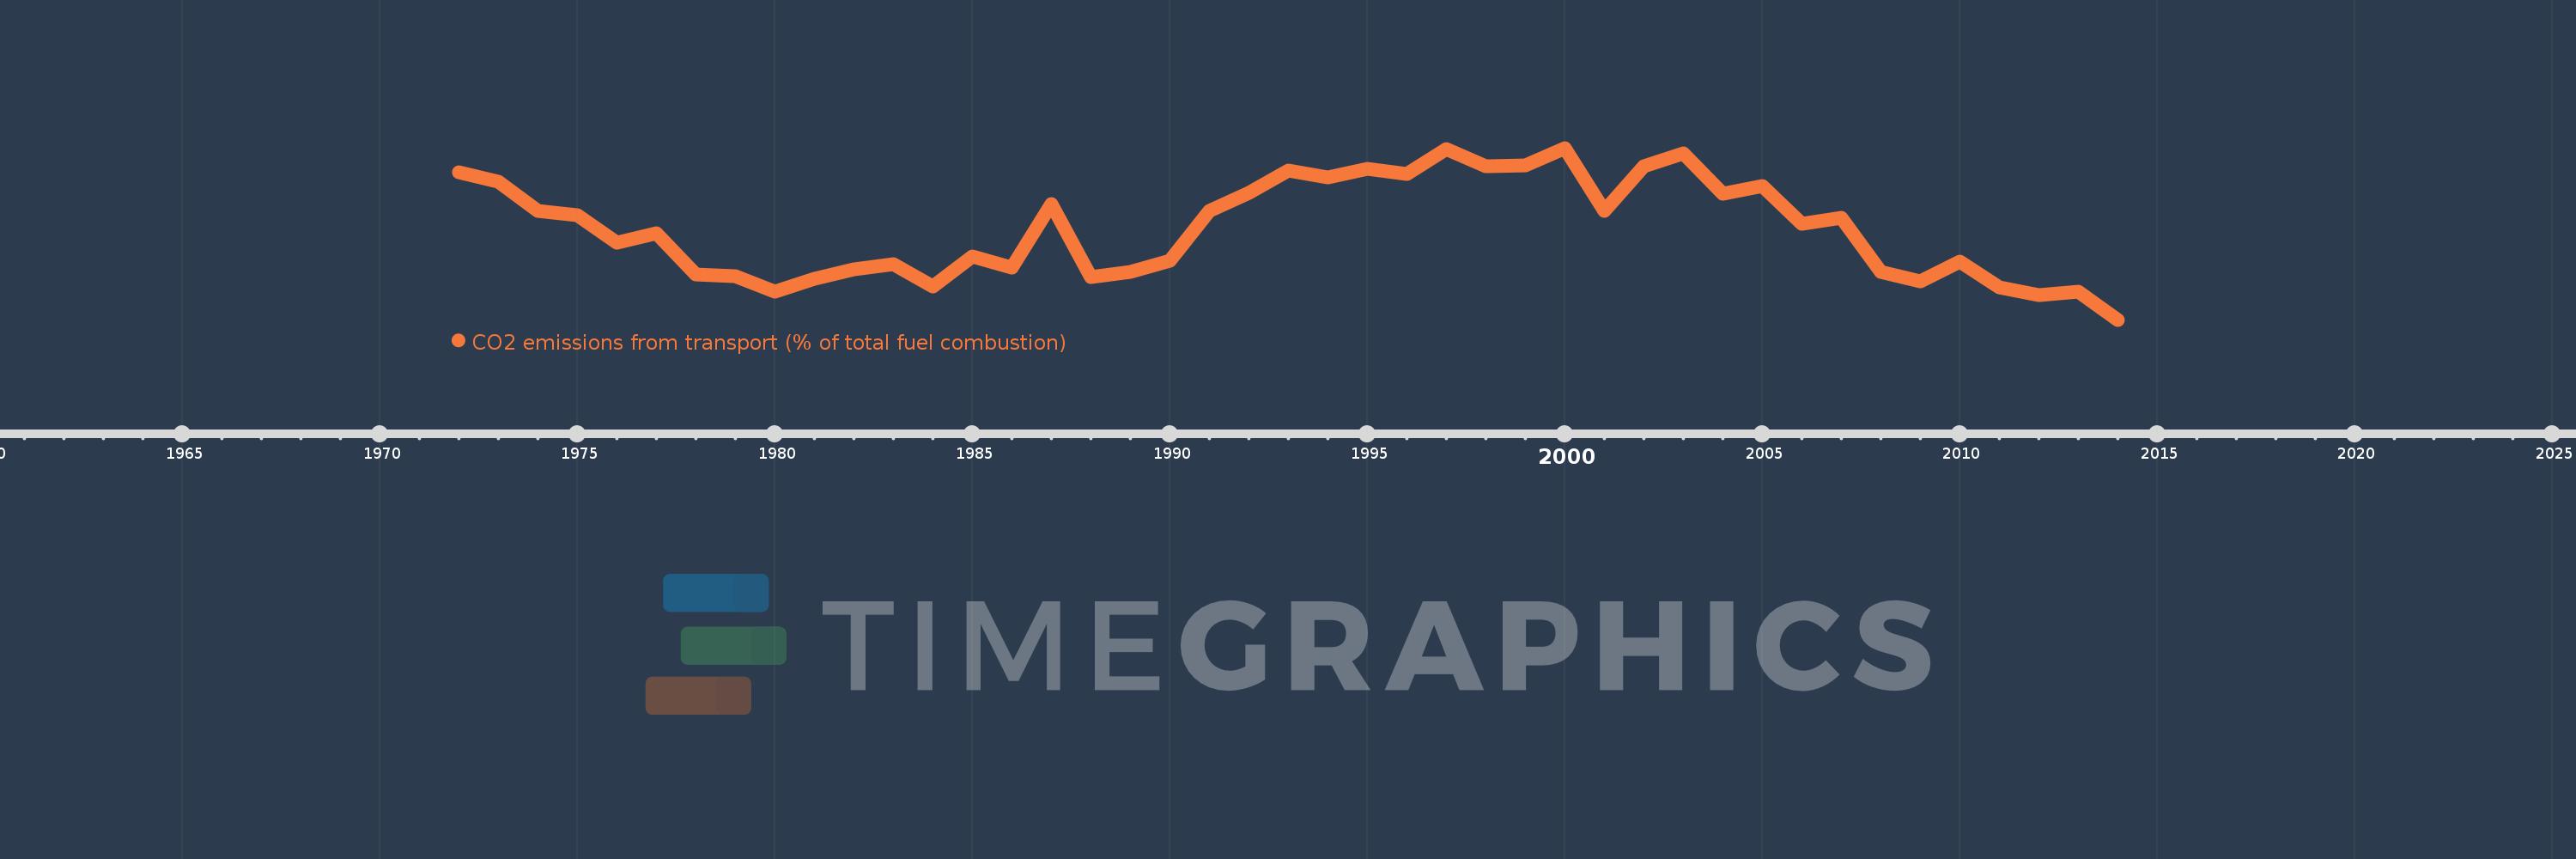
CO2 emissions from transport (% of total fuel combustion)
2014,2013,2012,2011,2010,2009,2008,2007,2006,2005,2004,2003,2002,2001,2000,1999,1998,1997,1996,1995,1994,1993,1992,1991,1990,1989,1988,1987,1986,1985,1984,1983,1982,1981,1980,1979,1978,1977,1976,1975,1974,1973,1972
This statistics in other country:
AlbaniaAlgeriaAngolaArab WorldArgentinaArmeniaAustraliaAustriaAzerbaijanBahrainBangladeshBelarusBelgiumBeninBoliviaBosnia and HerzegovinaBotswanaBrazilBrunei DarussalamBulgariaCambodiaCameroonCanadaCaribbean small statesCentral Europe and the BalticsChileChinaColombiaCongo, Dem. Rep.Congo, Rep.Costa RicaCote d'IvoireCroatiaCubaCuracaoCyprusCzech RepublicDenmarkDominican RepublicEarly-demographic dividendEast Asia & PacificEast Asia & Pacific (excluding high income)East Asia & Pacific (IDA & IBRD countries)EcuadorEgypt, Arab Rep.El SalvadorEritreaEstoniaEthiopiaEuro areaEurope & Central AsiaEurope & Central Asia (excluding high income)Europe & Central Asia (IDA & IBRD countries)European UnionFinlandFragile and conflict affected situationsFranceGabonGeorgiaGermanyGhanaGibraltarGreeceGuatemalaHaitiHeavily indebted poor countries (HIPC)High incomeHondurasHong Kong SAR, ChinaHungaryIBRD onlyIcelandIDA & IBRD totalIDA blendIDA onlyIDA totalIndiaIndonesiaIran, Islamic Rep.IraqIrelandIsraelItalyJamaicaJapanJordanKazakhstanKenyaKorea, Dem. People’s Rep.Korea, Rep.KosovoKuwaitKyrgyz RepublicLate-demographic dividendLatin America & Caribbean Latin America & Caribbean (excluding high income)Latin America & the Caribbean (IDA & IBRD countries)LatviaLeast developed countries: UN classificationLebanonLibyaLithuaniaLow & middle incomeLow incomeLower middle incomeLuxembourgMacedonia, FYRMalaysiaMaltaMauritiusMexicoMiddle East & North AfricaMiddle East & North Africa (excluding high income)Middle East & North Africa (IDA & IBRD countries)Middle incomeMoldovaMongoliaMontenegroMoroccoMozambiqueMyanmarNamibiaNepalNetherlandsNew ZealandNicaraguaNigerNigeriaNorth AmericaNorwayOECD membersOmanOther small statesPakistanPanamaParaguayPeruPhilippinesPolandPortugalPost-demographic dividendPre-demographic dividendQatarRomaniaRussian FederationSaudi ArabiaSenegalSerbiaSingaporeSlovak RepublicSloveniaSmall statesSouth AfricaSouth AsiaSouth Asia (IDA & IBRD)South SudanSpainSri LankaSub-Saharan Africa Sub-Saharan Africa (excluding high income)Sub-Saharan Africa (IDA & IBRD countries)SudanSwedenSwitzerlandSyrian Arab RepublicTajikistanTanzaniaThailandTogoTrinidad and TobagoTunisiaTurkeyTurkmenistanUkraineUnited Arab EmiratesUnited KingdomUnited StatesUpper middle incomeUruguayUzbekistanVenezuela, RBVietnamWorldYemen, Rep.ZambiaZimbabwe Timeline:
This timeline shows a graph from 1972 to 2014 of Philippines. No data until 1971. Number of actual observations by date: 43.
Source name:
World Development Indicators
Source organization:
IEA Statistics © OECD/IEA 2014 (http://www.iea.org/stats/index.asp), subject to https://www.iea.org/t&c/termsandconditions/
Categories, topics:
Environment
Last updated:
apr 23, 2017
Indicators value changes by year
Minimum:
28.517
jan 1, 2014
Maximum:
40.489
jan 1, 2000
At the date of observation
Value
Absolute change
Change from previous value
jan 1, 1972
38.766
+38.766
0.0%
jan 1, 1973
38.125
-0.641
-1.65%
jan 1, 1974
36.073
-2.052
-5.38%
jan 1, 1975
35.821
-0.252
-0.7%
jan 1, 1976
33.863
-1.958
-5.47%
jan 1, 1977
34.515
+0.652
1.92%
jan 1, 1978
31.695
-2.819
-8.17%
jan 1, 1979
31.54
-0.155
-0.49%
jan 1, 1980
30.491
-1.049
-3.33%
jan 1, 1981
31.383
+0.892
2.93%
jan 1, 1982
32.027
+0.643
2.05%
jan 1, 1983
32.395
+0.369
1.15%
jan 1, 1984
30.805
-1.59
-4.91%
jan 1, 1985
32.917
+2.111
6.85%
jan 1, 1986
32.175
-0.741
-2.25%
jan 1, 1987
36.56
+4.385
13.63%
jan 1, 1988
31.466
-5.094
-13.93%
jan 1, 1989
31.833
+0.366
1.16%
jan 1, 1990
32.623
+0.79
2.48%
jan 1, 1991
36.12
+3.497
10.72%
jan 1, 1992
37.343
+1.223
3.39%
jan 1, 1993
38.888
+1.545
4.14%
jan 1, 1994
38.441
-0.447
-1.15%
jan 1, 1995
39.016
+0.575
1.5%
jan 1, 1996
38.679
-0.336
-0.86%
jan 1, 1997
40.409
+1.73
4.47%
jan 1, 1998
39.192
-1.217
-3.01%
jan 1, 1999
39.259
+0.068
0.17%
jan 1, 2000
40.489
+1.229
3.13%
jan 1, 2001
36.103
-4.386
-10.83%
jan 1, 2002
39.243
+3.139
8.7%
jan 1, 2003
40.132
+0.889
2.27%
jan 1, 2004
37.328
-2.804
-6.99%
jan 1, 2005
37.824
+0.496
1.33%
jan 1, 2006
35.185
-2.64
-6.98%
jan 1, 2007
35.648
+0.463
1.32%
jan 1, 2008
31.841
-3.807
-10.68%
jan 1, 2009
31.183
-0.657
-2.06%
jan 1, 2010
32.596
+1.413
4.53%
jan 1, 2011
30.787
-1.809
-5.55%
jan 1, 2012
30.255
-0.532
-1.73%
jan 1, 2013
30.464
+0.209
0.69%
jan 1, 2014
28.517
-1.947
-6.39%
Ranking of countries by current statistics by years


Comments: