29
/
en
AIzaSyAYiBZKx7MnpbEhh9jyipgxe19OcubqV5w
April 1, 2024
275503
United Kingdom
GBR
true
2
1
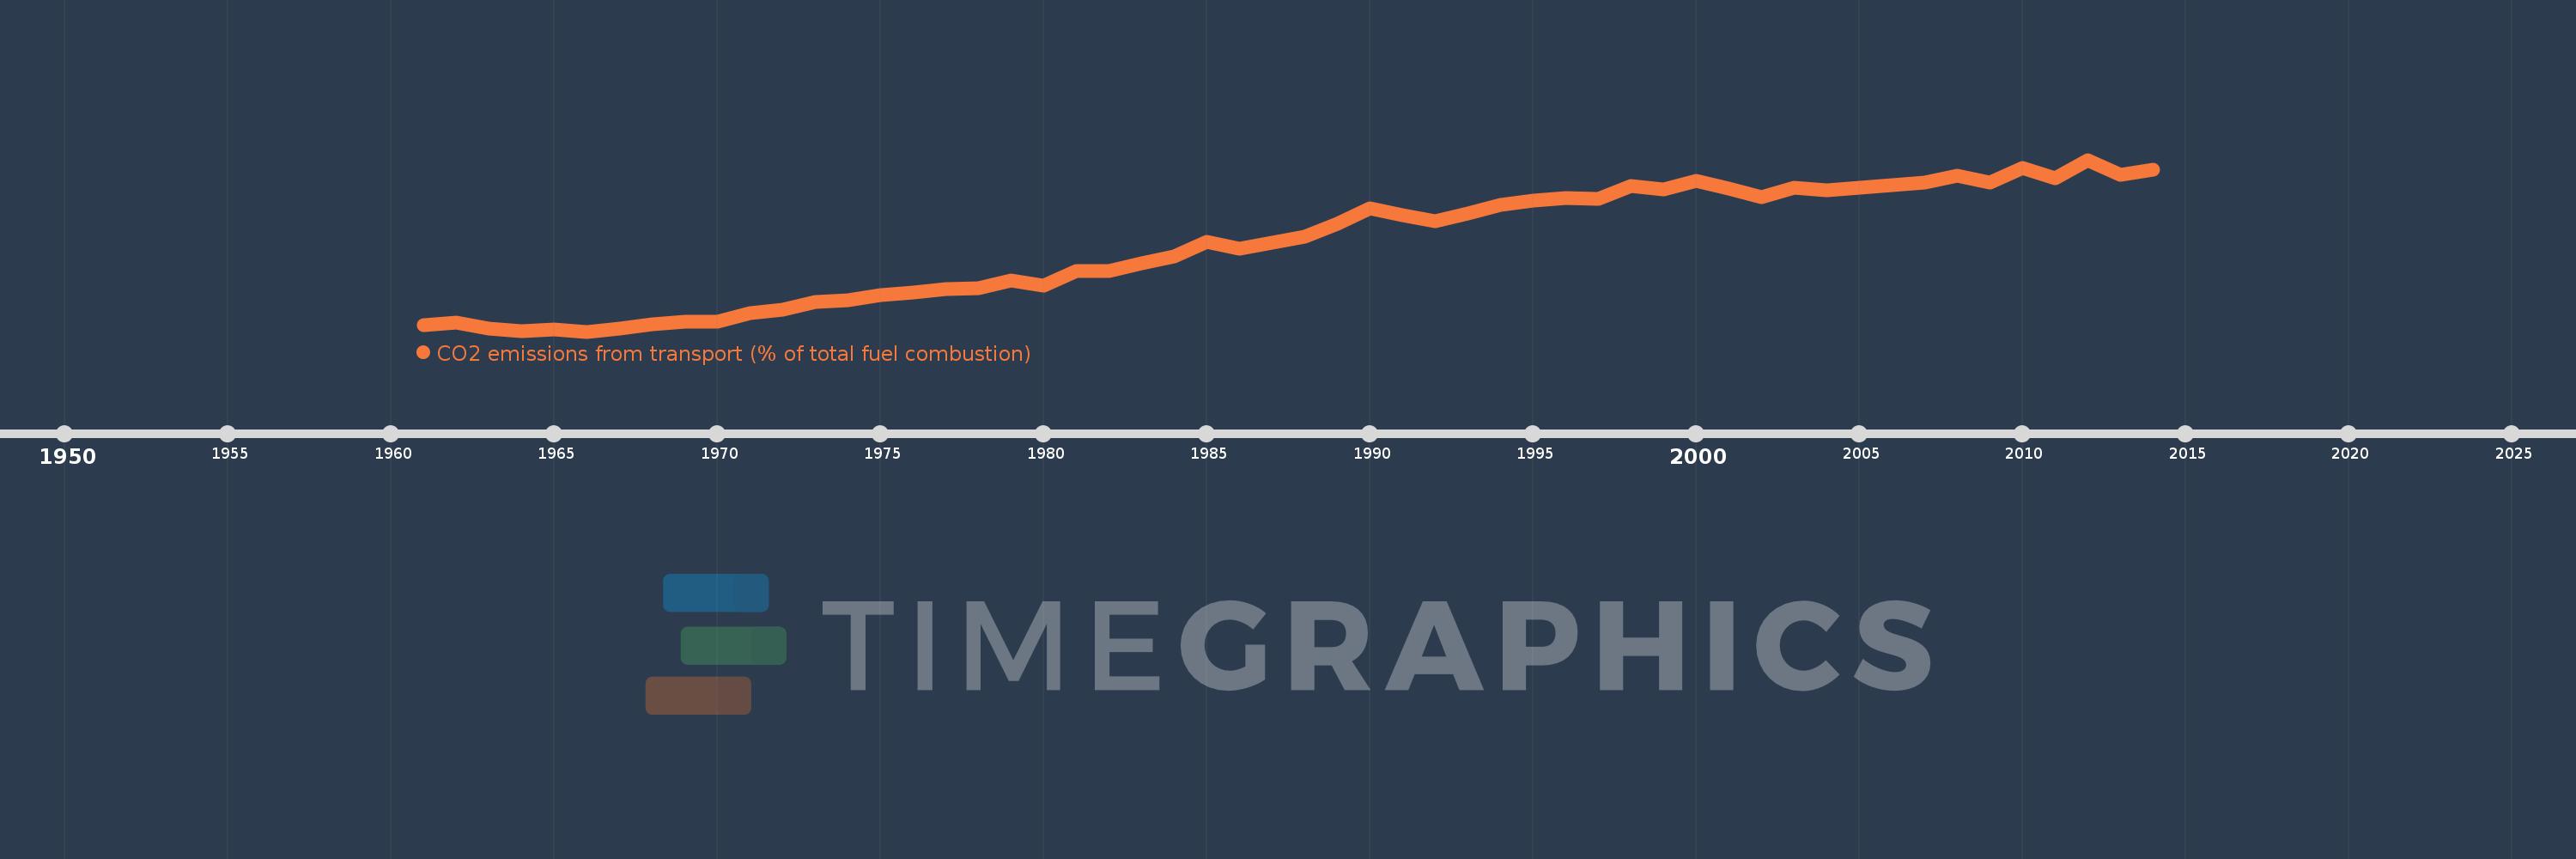
CO2 emissions from transport (% of total fuel combustion)
2014,2013,2012,2011,2010,2009,2008,2007,2006,2005,2004,2003,2002,2001,2000,1999,1998,1997,1996,1995,1994,1993,1992,1991,1990,1989,1988,1987,1986,1985,1984,1983,1982,1981,1980,1979,1978,1977,1976,1975,1974,1973,1972,1971,1970,1969,1968,1967,1966,1965,1964,1963,1962,1961
This statistics in other country:
AlbaniaAlgeriaAngolaArab WorldArgentinaArmeniaAustraliaAustriaAzerbaijanBahrainBangladeshBelarusBelgiumBeninBoliviaBosnia and HerzegovinaBotswanaBrazilBrunei DarussalamBulgariaCambodiaCameroonCanadaCaribbean small statesCentral Europe and the BalticsChileChinaColombiaCongo, Dem. Rep.Congo, Rep.Costa RicaCote d'IvoireCroatiaCubaCuracaoCyprusCzech RepublicDenmarkDominican RepublicEarly-demographic dividendEast Asia & PacificEast Asia & Pacific (excluding high income)East Asia & Pacific (IDA & IBRD countries)EcuadorEgypt, Arab Rep.El SalvadorEritreaEstoniaEthiopiaEuro areaEurope & Central AsiaEurope & Central Asia (excluding high income)Europe & Central Asia (IDA & IBRD countries)European UnionFinlandFragile and conflict affected situationsFranceGabonGeorgiaGermanyGhanaGibraltarGreeceGuatemalaHaitiHeavily indebted poor countries (HIPC)High incomeHondurasHong Kong SAR, ChinaHungaryIBRD onlyIcelandIDA & IBRD totalIDA blendIDA onlyIDA totalIndiaIndonesiaIran, Islamic Rep.IraqIrelandIsraelItalyJamaicaJapanJordanKazakhstanKenyaKorea, Dem. People’s Rep.Korea, Rep.KosovoKuwaitKyrgyz RepublicLate-demographic dividendLatin America & Caribbean Latin America & Caribbean (excluding high income)Latin America & the Caribbean (IDA & IBRD countries)LatviaLeast developed countries: UN classificationLebanonLibyaLithuaniaLow & middle incomeLow incomeLower middle incomeLuxembourgMacedonia, FYRMalaysiaMaltaMauritiusMexicoMiddle East & North AfricaMiddle East & North Africa (excluding high income)Middle East & North Africa (IDA & IBRD countries)Middle incomeMoldovaMongoliaMontenegroMoroccoMozambiqueMyanmarNamibiaNepalNetherlandsNew ZealandNicaraguaNigerNigeriaNorth AmericaNorwayOECD membersOmanOther small statesPakistanPanamaParaguayPeruPhilippinesPolandPortugalPost-demographic dividendPre-demographic dividendQatarRomaniaRussian FederationSaudi ArabiaSenegalSerbiaSingaporeSlovak RepublicSloveniaSmall statesSouth AfricaSouth AsiaSouth Asia (IDA & IBRD)South SudanSpainSri LankaSub-Saharan Africa Sub-Saharan Africa (excluding high income)Sub-Saharan Africa (IDA & IBRD countries)SudanSwedenSwitzerlandSyrian Arab RepublicTajikistanTanzaniaThailandTogoTrinidad and TobagoTunisiaTurkeyTurkmenistanUkraineUnited Arab EmiratesUnited KingdomUnited StatesUpper middle incomeUruguayUzbekistanVenezuela, RBVietnamWorldYemen, Rep.ZambiaZimbabwe Timeline:
This timeline shows a graph from 1961 to 2014 of United Kingdom. No data until 1960. Number of actual observations by date: 54.
Source name:
World Development Indicators
Source organization:
IEA Statistics © OECD/IEA 2014 (http://www.iea.org/stats/index.asp), subject to https://www.iea.org/t&c/termsandconditions/
Categories, topics:
Environment
Last updated:
apr 23, 2017
Indicators value changes by year
Maximum:
26.381
jan 1, 2012
At the date of observation
Value
Absolute change
Change from previous value
jan 1, 1961
10.361
+10.361
0.0%
jan 1, 1962
10.6
+0.239
2.31%
jan 1, 1963
10.091
-0.509
-4.8%
jan 1, 1964
9.806
-0.285
-2.83%
jan 1, 1965
9.957
+0.151
1.54%
jan 1, 1966
9.764
-0.193
-1.94%
jan 1, 1967
10.061
+0.296
3.04%
jan 1, 1968
10.461
+0.401
3.98%
jan 1, 1969
10.736
+0.274
2.62%
jan 1, 1970
10.729
-0.007
-0.06%
jan 1, 1971
11.515
+0.786
7.32%
jan 1, 1972
11.866
+0.352
3.05%
jan 1, 1973
12.662
+0.796
6.71%
jan 1, 1974
12.823
+0.161
1.27%
jan 1, 1975
13.293
+0.47
3.66%
jan 1, 1976
13.504
+0.211
1.58%
jan 1, 1977
13.855
+0.351
2.6%
jan 1, 1978
13.968
+0.113
0.82%
jan 1, 1979
14.685
+0.716
5.13%
jan 1, 1980
14.208
-0.476
-3.24%
jan 1, 1981
15.634
+1.426
10.03%
jan 1, 1982
15.595
-0.039
-0.25%
jan 1, 1983
16.342
+0.747
4.79%
jan 1, 1984
17.063
+0.721
4.41%
jan 1, 1985
18.475
+1.413
8.28%
jan 1, 1986
17.759
-0.716
-3.88%
jan 1, 1987
18.39
+0.63
3.55%
jan 1, 1988
18.92
+0.531
2.89%
jan 1, 1989
20.206
+1.286
6.8%
jan 1, 1990
21.679
+1.473
7.29%
jan 1, 1991
20.987
-0.691
-3.19%
jan 1, 1992
20.417
-0.57
-2.72%
jan 1, 1993
21.156
+0.739
3.62%
jan 1, 1994
22.051
+0.895
4.23%
jan 1, 1995
22.435
+0.384
1.74%
jan 1, 1996
22.643
+0.207
0.92%
jan 1, 1997
22.641
-0.002
-0.01%
jan 1, 1998
23.825
+1.184
5.23%
jan 1, 1999
23.521
-0.304
-1.28%
jan 1, 2000
24.331
+0.81
3.44%
jan 1, 2001
23.586
-0.744
-3.06%
jan 1, 2002
22.756
-0.83
-3.52%
jan 1, 2003
23.686
+0.93
4.09%
jan 1, 2004
23.4
-0.286
-1.21%
jan 1, 2005
23.645
+0.245
1.05%
jan 1, 2006
23.942
+0.297
1.26%
jan 1, 2007
24.188
+0.246
1.03%
jan 1, 2008
24.841
+0.653
2.7%
jan 1, 2009
24.157
-0.684
-2.75%
jan 1, 2010
25.606
+1.449
6.0%
jan 1, 2011
24.565
-1.042
-4.07%
jan 1, 2012
26.381
+1.816
7.39%
jan 1, 2013
24.959
-1.421
-5.39%
jan 1, 2014
25.408
+0.449
1.8%
Ranking of countries by current statistics by years


Comments: