29
/
en
AIzaSyAYiBZKx7MnpbEhh9jyipgxe19OcubqV5w
April 1, 2024
39773
IDA total
IDA
false
2
1
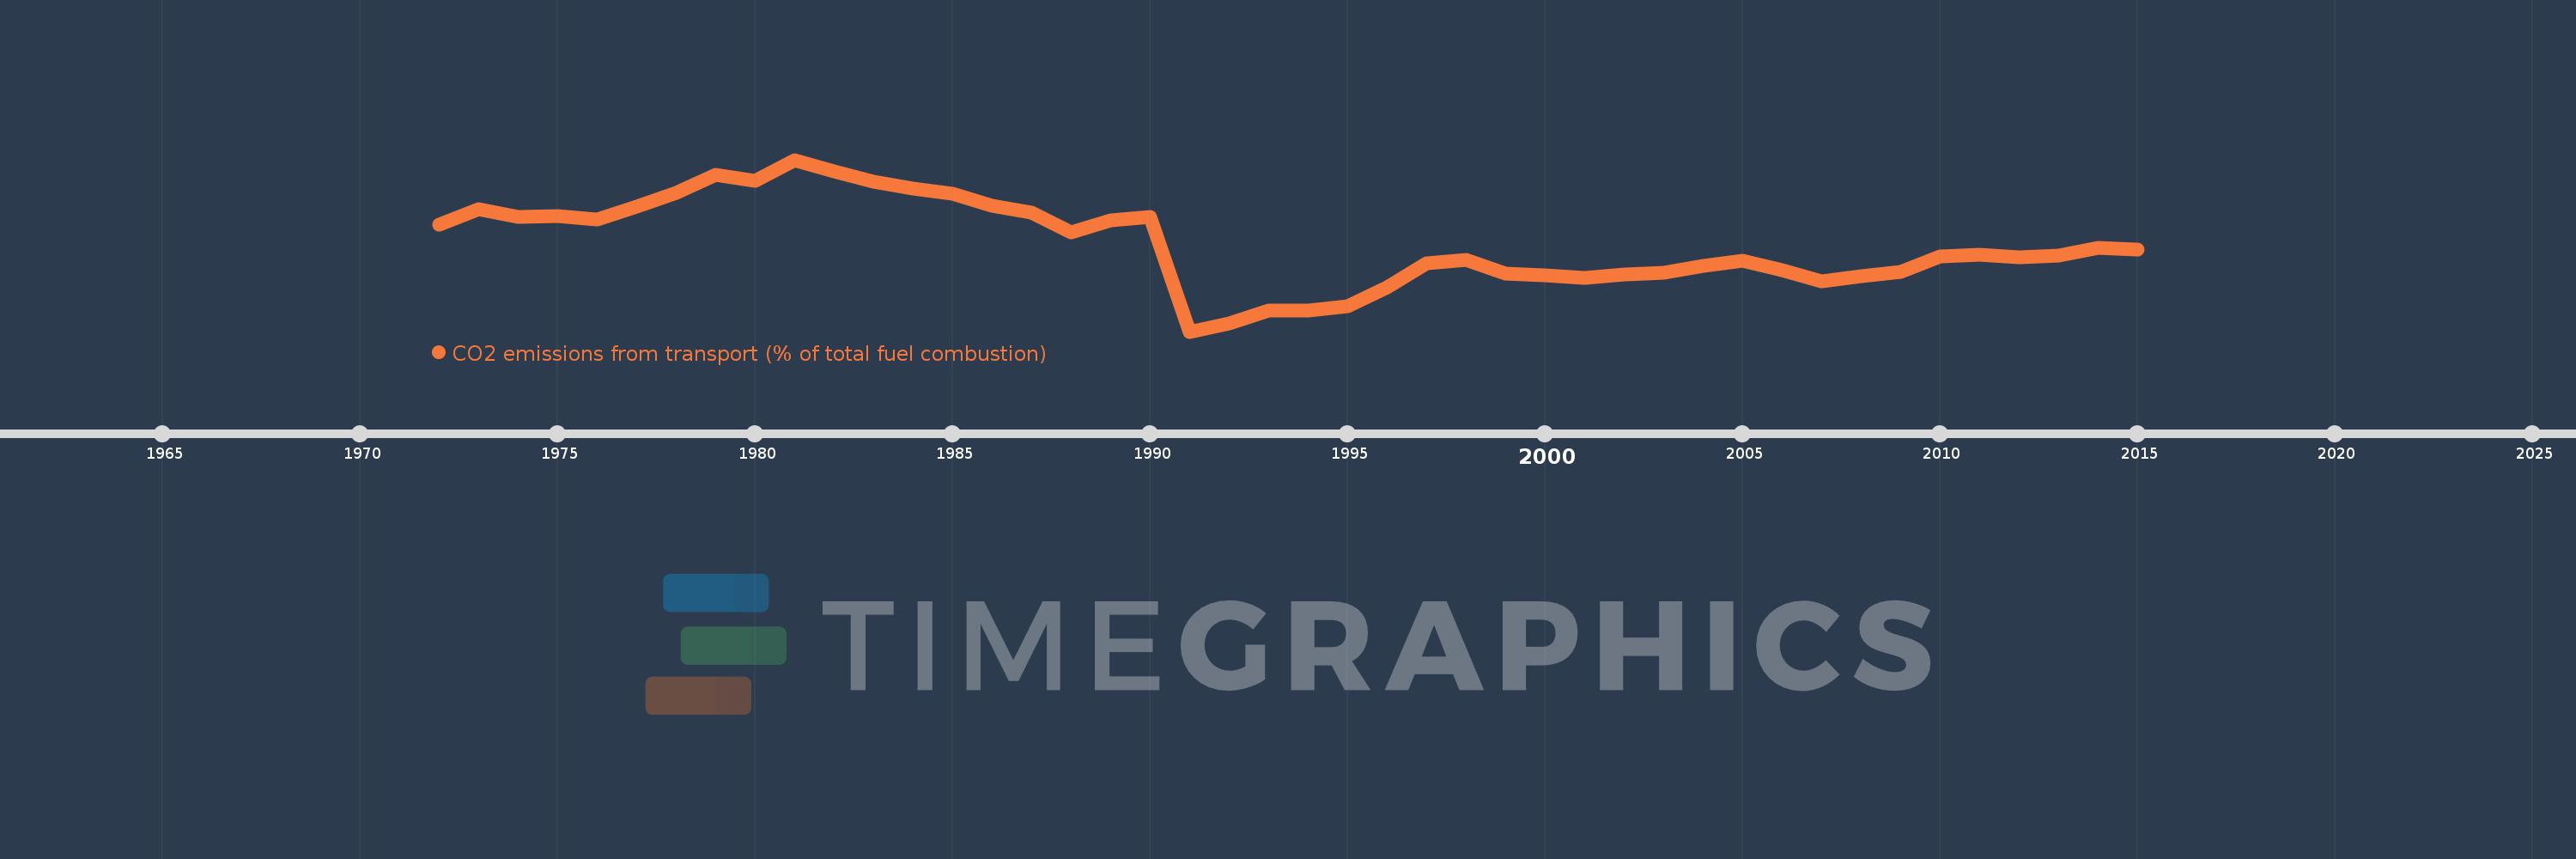
CO2 emissions from transport (% of total fuel combustion)
2015,2014,2013,2012,2011,2010,2009,2008,2007,2006,2005,2004,2003,2002,2001,2000,1999,1998,1997,1996,1995,1994,1993,1992,1991,1990,1989,1988,1987,1986,1985,1984,1983,1982,1981,1980,1979,1978,1977,1976,1975,1974,1973,1972
This statistics in other country:
AlbaniaAlgeriaAngolaArab WorldArgentinaArmeniaAustraliaAustriaAzerbaijanBahrainBangladeshBelarusBelgiumBeninBoliviaBosnia and HerzegovinaBotswanaBrazilBrunei DarussalamBulgariaCambodiaCameroonCanadaCaribbean small statesCentral Europe and the BalticsChileChinaColombiaCongo, Dem. Rep.Congo, Rep.Costa RicaCote d'IvoireCroatiaCubaCuracaoCyprusCzech RepublicDenmarkDominican RepublicEarly-demographic dividendEast Asia & PacificEast Asia & Pacific (excluding high income)East Asia & Pacific (IDA & IBRD countries)EcuadorEgypt, Arab Rep.El SalvadorEritreaEstoniaEthiopiaEuro areaEurope & Central AsiaEurope & Central Asia (excluding high income)Europe & Central Asia (IDA & IBRD countries)European UnionFinlandFragile and conflict affected situationsFranceGabonGeorgiaGermanyGhanaGibraltarGreeceGuatemalaHaitiHeavily indebted poor countries (HIPC)High incomeHondurasHong Kong SAR, ChinaHungaryIBRD onlyIcelandIDA & IBRD totalIDA blendIDA onlyIDA totalIndiaIndonesiaIran, Islamic Rep.IraqIrelandIsraelItalyJamaicaJapanJordanKazakhstanKenyaKorea, Dem. People’s Rep.Korea, Rep.KosovoKuwaitKyrgyz RepublicLate-demographic dividendLatin America & Caribbean Latin America & Caribbean (excluding high income)Latin America & the Caribbean (IDA & IBRD countries)LatviaLeast developed countries: UN classificationLebanonLibyaLithuaniaLow & middle incomeLow incomeLower middle incomeLuxembourgMacedonia, FYRMalaysiaMaltaMauritiusMexicoMiddle East & North AfricaMiddle East & North Africa (excluding high income)Middle East & North Africa (IDA & IBRD countries)Middle incomeMoldovaMongoliaMontenegroMoroccoMozambiqueMyanmarNamibiaNepalNetherlandsNew ZealandNicaraguaNigerNigeriaNorth AmericaNorwayOECD membersOmanOther small statesPakistanPanamaParaguayPeruPhilippinesPolandPortugalPost-demographic dividendPre-demographic dividendQatarRomaniaRussian FederationSaudi ArabiaSenegalSerbiaSingaporeSlovak RepublicSloveniaSmall statesSouth AfricaSouth AsiaSouth Asia (IDA & IBRD)South SudanSpainSri LankaSub-Saharan Africa Sub-Saharan Africa (excluding high income)Sub-Saharan Africa (IDA & IBRD countries)SudanSwedenSwitzerlandSyrian Arab RepublicTajikistanTanzaniaThailandTogoTrinidad and TobagoTunisiaTurkeyTurkmenistanUkraineUnited Arab EmiratesUnited KingdomUnited StatesUpper middle incomeUruguayUzbekistanVenezuela, RBVietnamWorldYemen, Rep.ZambiaZimbabwe Timeline:
This timeline shows a graph from 1972 to 2015 of IDA total. No data until 1971. Number of actual observations by date: 44.
Source name:
World Development Indicators
Source organization:
IEA Statistics © OECD/IEA 2014 (http://www.iea.org/stats/index.asp), subject to https://www.iea.org/t&c/termsandconditions/
Categories, topics:
Environment
Last updated:
apr 23, 2017
Indicators value changes by year
Minimum:
21.279
jan 1, 1991
Maximum:
36.518
jan 1, 1981
At the date of observation
Value
Absolute change
Change from previous value
jan 1, 1972
30.792
+30.792
0.0%
jan 1, 1973
32.138
+1.345
4.37%
jan 1, 1974
31.47
-0.667
-2.08%
jan 1, 1975
31.537
+0.067
0.21%
jan 1, 1976
31.24
-0.297
-0.94%
jan 1, 1977
32.348
+1.108
3.55%
jan 1, 1978
33.573
+1.225
3.79%
jan 1, 1979
35.147
+1.574
4.69%
jan 1, 1980
34.65
-0.497
-1.41%
jan 1, 1981
36.518
+1.867
5.39%
jan 1, 1982
35.48
-1.037
-2.84%
jan 1, 1983
34.538
-0.942
-2.66%
jan 1, 1984
33.934
-0.604
-1.75%
jan 1, 1985
33.531
-0.403
-1.19%
jan 1, 1986
32.426
-1.105
-3.3%
jan 1, 1987
31.869
-0.557
-1.72%
jan 1, 1988
30.098
-1.771
-5.56%
jan 1, 1989
31.148
+1.05
3.49%
jan 1, 1990
31.435
+0.287
0.92%
jan 1, 1991
21.279
-10.156
-32.31%
jan 1, 1992
22.0
+0.721
3.39%
jan 1, 1993
23.177
+1.176
5.35%
jan 1, 1994
23.156
-0.021
-0.09%
jan 1, 1995
23.522
+0.366
1.58%
jan 1, 1996
25.23
+1.709
7.26%
jan 1, 1997
27.31
+2.079
8.24%
jan 1, 1998
27.679
+0.369
1.35%
jan 1, 1999
26.386
-1.293
-4.67%
jan 1, 2000
26.258
-0.128
-0.48%
jan 1, 2001
26.079
-0.179
-0.68%
jan 1, 2002
26.314
+0.235
0.9%
jan 1, 2003
26.481
+0.167
0.64%
jan 1, 2004
27.138
+0.657
2.48%
jan 1, 2005
27.574
+0.436
1.6%
jan 1, 2006
26.76
-0.813
-2.95%
jan 1, 2007
25.739
-1.021
-3.81%
jan 1, 2008
26.197
+0.458
1.78%
jan 1, 2009
26.574
+0.377
1.44%
jan 1, 2010
27.933
+1.359
5.11%
jan 1, 2011
28.091
+0.158
0.57%
jan 1, 2012
27.852
-0.24
-0.85%
jan 1, 2013
28.01
+0.159
0.57%
jan 1, 2014
28.677
+0.666
2.38%
jan 1, 2015
28.566
-0.111
-0.39%
Ranking of countries by current statistics by years


Comments: