29
/
en
AIzaSyAYiBZKx7MnpbEhh9jyipgxe19OcubqV5w
April 1, 2024
241396
Slovak Republic
SVK
true
2
1
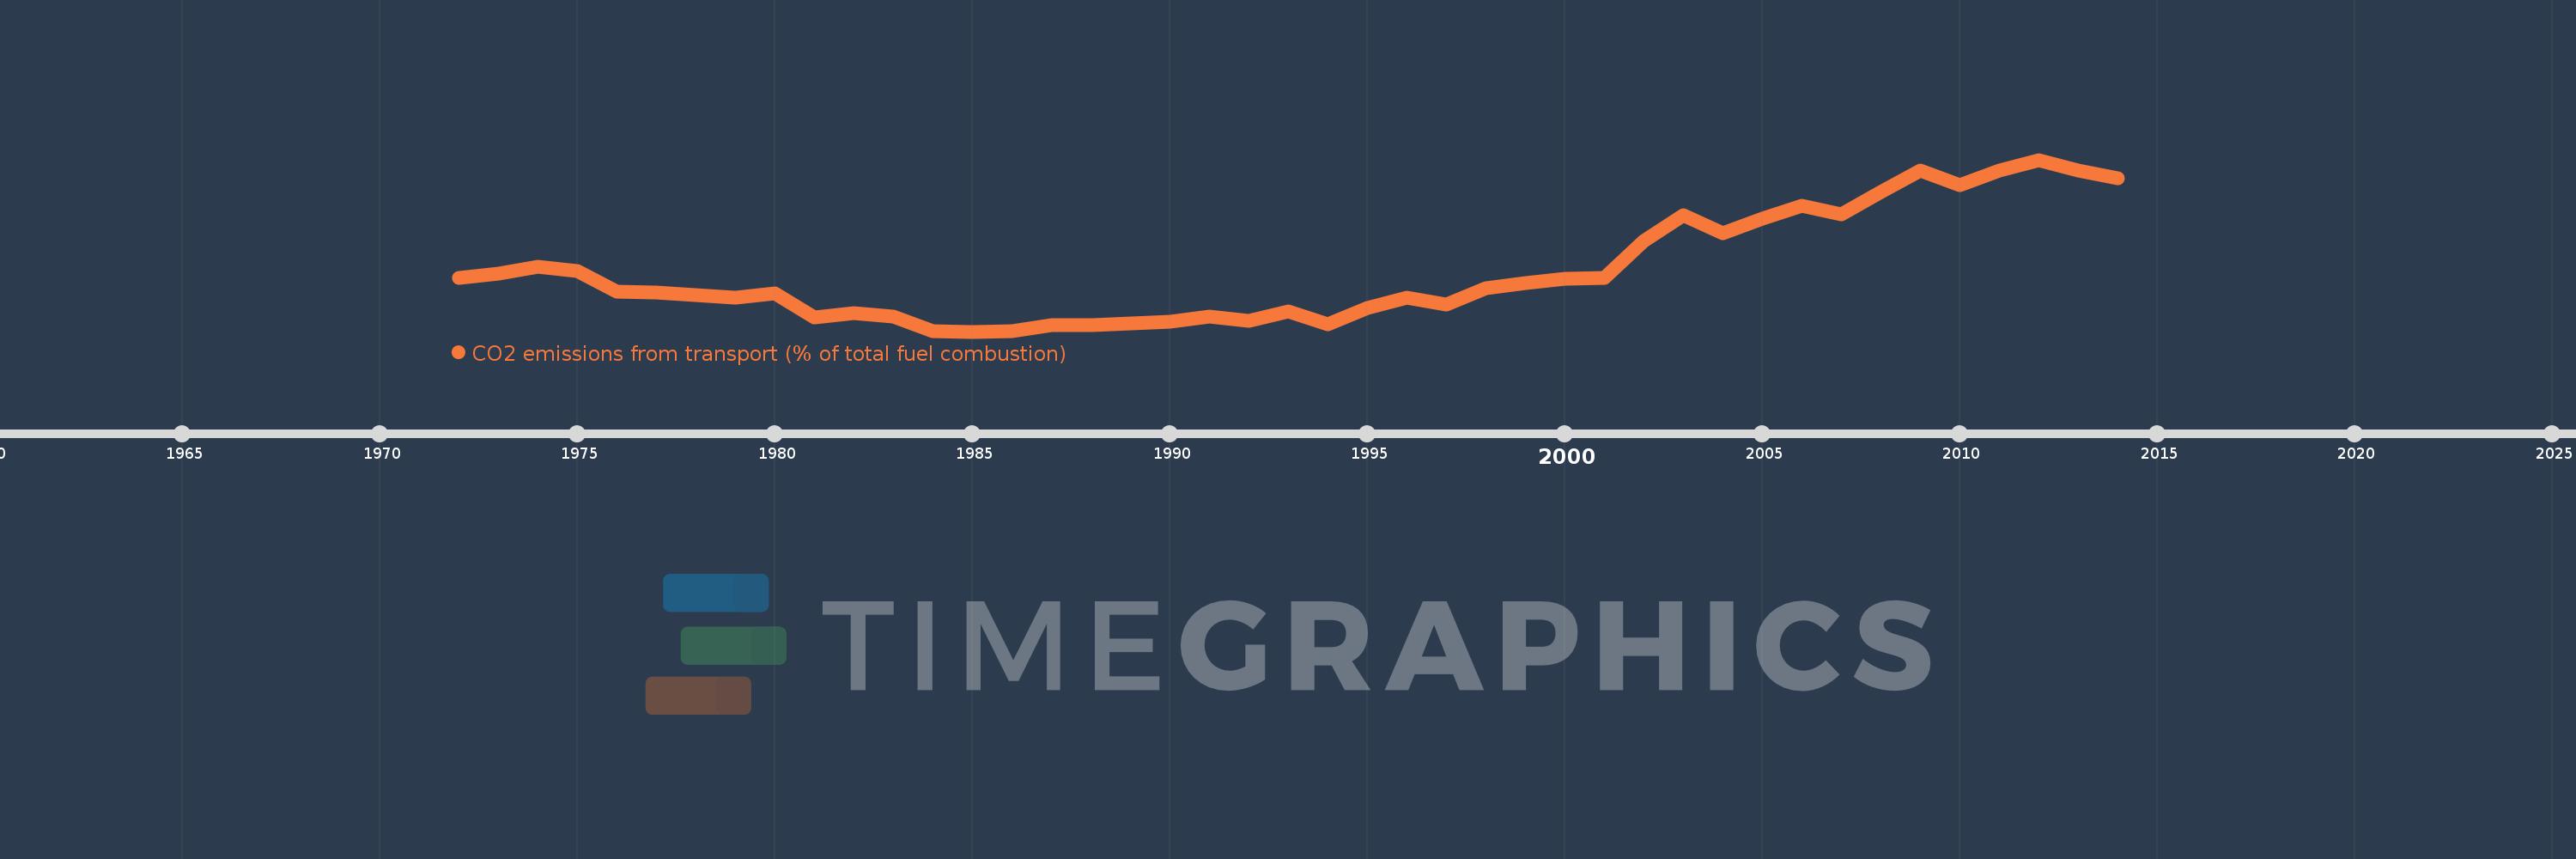
CO2 emissions from transport (% of total fuel combustion)
2014,2013,2012,2011,2010,2009,2008,2007,2006,2005,2004,2003,2002,2001,2000,1999,1998,1997,1996,1995,1994,1993,1992,1991,1990,1989,1988,1987,1986,1985,1984,1983,1982,1981,1980,1979,1978,1977,1976,1975,1974,1973,1972
This statistics in other country:
AlbaniaAlgeriaAngolaArab WorldArgentinaArmeniaAustraliaAustriaAzerbaijanBahrainBangladeshBelarusBelgiumBeninBoliviaBosnia and HerzegovinaBotswanaBrazilBrunei DarussalamBulgariaCambodiaCameroonCanadaCaribbean small statesCentral Europe and the BalticsChileChinaColombiaCongo, Dem. Rep.Congo, Rep.Costa RicaCote d'IvoireCroatiaCubaCuracaoCyprusCzech RepublicDenmarkDominican RepublicEarly-demographic dividendEast Asia & PacificEast Asia & Pacific (excluding high income)East Asia & Pacific (IDA & IBRD countries)EcuadorEgypt, Arab Rep.El SalvadorEritreaEstoniaEthiopiaEuro areaEurope & Central AsiaEurope & Central Asia (excluding high income)Europe & Central Asia (IDA & IBRD countries)European UnionFinlandFragile and conflict affected situationsFranceGabonGeorgiaGermanyGhanaGibraltarGreeceGuatemalaHaitiHeavily indebted poor countries (HIPC)High incomeHondurasHong Kong SAR, ChinaHungaryIBRD onlyIcelandIDA & IBRD totalIDA blendIDA onlyIDA totalIndiaIndonesiaIran, Islamic Rep.IraqIrelandIsraelItalyJamaicaJapanJordanKazakhstanKenyaKorea, Dem. People’s Rep.Korea, Rep.KosovoKuwaitKyrgyz RepublicLate-demographic dividendLatin America & Caribbean Latin America & Caribbean (excluding high income)Latin America & the Caribbean (IDA & IBRD countries)LatviaLeast developed countries: UN classificationLebanonLibyaLithuaniaLow & middle incomeLow incomeLower middle incomeLuxembourgMacedonia, FYRMalaysiaMaltaMauritiusMexicoMiddle East & North AfricaMiddle East & North Africa (excluding high income)Middle East & North Africa (IDA & IBRD countries)Middle incomeMoldovaMongoliaMontenegroMoroccoMozambiqueMyanmarNamibiaNepalNetherlandsNew ZealandNicaraguaNigerNigeriaNorth AmericaNorwayOECD membersOmanOther small statesPakistanPanamaParaguayPeruPhilippinesPolandPortugalPost-demographic dividendPre-demographic dividendQatarRomaniaRussian FederationSaudi ArabiaSenegalSerbiaSingaporeSlovak RepublicSloveniaSmall statesSouth AfricaSouth AsiaSouth Asia (IDA & IBRD)South SudanSpainSri LankaSub-Saharan Africa Sub-Saharan Africa (excluding high income)Sub-Saharan Africa (IDA & IBRD countries)SudanSwedenSwitzerlandSyrian Arab RepublicTajikistanTanzaniaThailandTogoTrinidad and TobagoTunisiaTurkeyTurkmenistanUkraineUnited Arab EmiratesUnited KingdomUnited StatesUpper middle incomeUruguayUzbekistanVenezuela, RBVietnamWorldYemen, Rep.ZambiaZimbabwe Timeline:
This timeline shows a graph from 1972 to 2014 of Slovak Republic. No data until 1971. Number of actual observations by date: 43.
Source name:
World Development Indicators
Source organization:
IEA Statistics © OECD/IEA 2014 (http://www.iea.org/stats/index.asp), subject to https://www.iea.org/t&c/termsandconditions/
Categories, topics:
Environment
Last updated:
apr 23, 2017
Indicators value changes by year
Maximum:
21.674
jan 1, 2012
At the date of observation
Value
Absolute change
Change from previous value
jan 1, 1972
10.96
+10.96
0.0%
jan 1, 1973
11.349
+0.389
3.55%
jan 1, 1974
12.006
+0.657
5.79%
jan 1, 1975
11.589
-0.417
-3.47%
jan 1, 1976
9.754
-1.835
-15.83%
jan 1, 1977
9.68
-0.075
-0.77%
jan 1, 1978
9.423
-0.256
-2.65%
jan 1, 1979
9.159
-0.264
-2.8%
jan 1, 1980
9.542
+0.383
4.18%
jan 1, 1981
7.384
-2.159
-22.62%
jan 1, 1982
7.805
+0.422
5.71%
jan 1, 1983
7.456
-0.349
-4.47%
jan 1, 1984
6.163
-1.293
-17.34%
jan 1, 1985
6.118
-0.045
-0.73%
jan 1, 1986
6.135
+0.017
0.28%
jan 1, 1987
6.672
+0.537
8.75%
jan 1, 1988
6.689
+0.017
0.26%
jan 1, 1989
6.83
+0.141
2.11%
jan 1, 1990
7.024
+0.195
2.85%
jan 1, 1991
7.459
+0.435
6.19%
jan 1, 1992
7.07
-0.39
-5.22%
jan 1, 1993
7.924
+0.854
12.08%
jan 1, 1994
6.79
-1.134
-14.31%
jan 1, 1995
8.253
+1.463
21.55%
jan 1, 1996
9.195
+0.941
11.41%
jan 1, 1997
8.569
-0.626
-6.81%
jan 1, 1998
10.01
+1.441
16.82%
jan 1, 1999
10.536
+0.526
5.25%
jan 1, 2000
10.919
+0.384
3.64%
jan 1, 2001
11.009
+0.089
0.82%
jan 1, 2002
14.293
+3.285
29.84%
jan 1, 2003
16.644
+2.351
16.45%
jan 1, 2004
15.053
-1.591
-9.56%
jan 1, 2005
16.377
+1.323
8.79%
jan 1, 2006
17.477
+1.1
6.72%
jan 1, 2007
16.753
-0.723
-4.14%
jan 1, 2008
18.745
+1.991
11.89%
jan 1, 2009
20.695
+1.95
10.4%
jan 1, 2010
19.387
-1.308
-6.32%
jan 1, 2011
20.689
+1.302
6.72%
jan 1, 2012
21.674
+0.986
4.76%
jan 1, 2013
20.711
-0.964
-4.45%
jan 1, 2014
19.981
-0.729
-3.52%
Ranking of countries by current statistics by years


Comments: