29
/
en
AIzaSyAYiBZKx7MnpbEhh9jyipgxe19OcubqV5w
April 1, 2024
162319
Jamaica
JAM
true
2
1
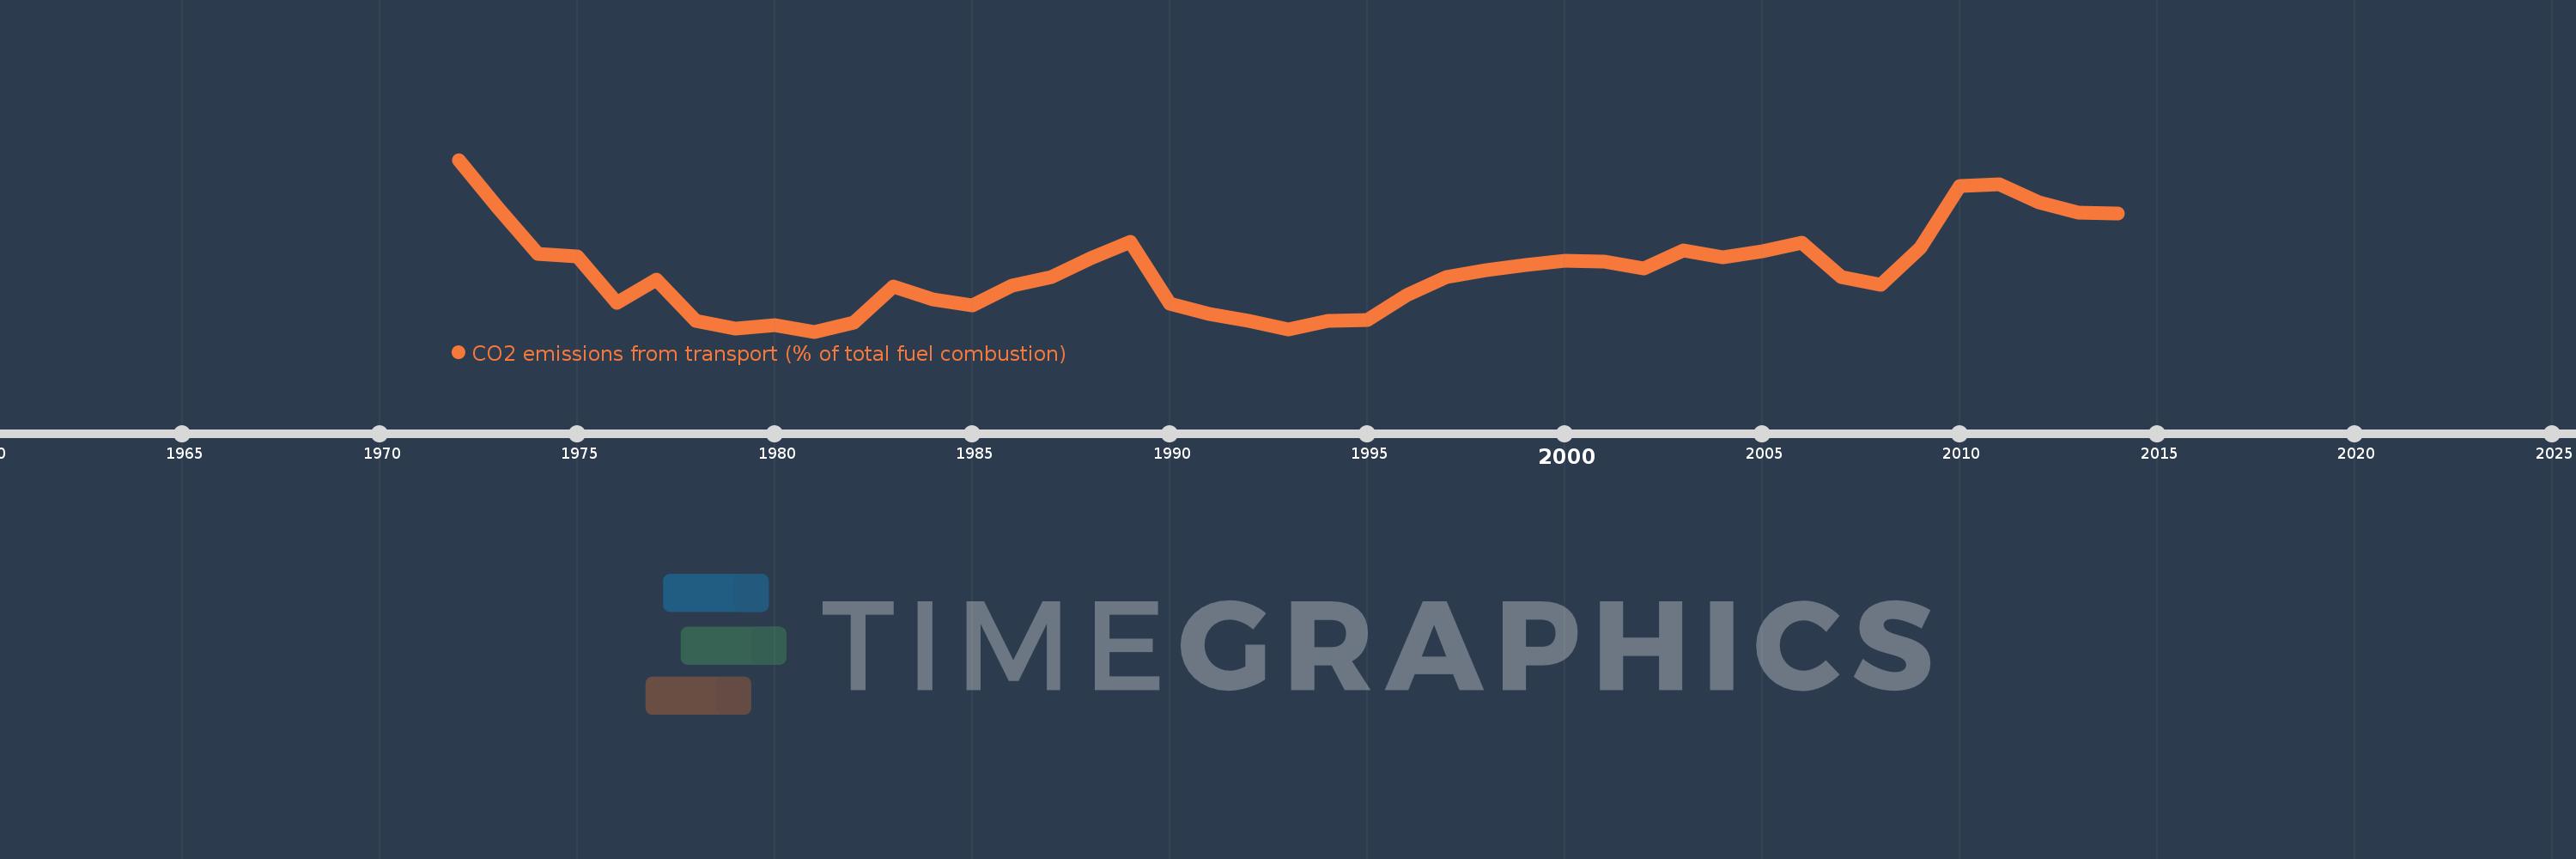
CO2 emissions from transport (% of total fuel combustion)
2014,2013,2012,2011,2010,2009,2008,2007,2006,2005,2004,2003,2002,2001,2000,1999,1998,1997,1996,1995,1994,1993,1992,1991,1990,1989,1988,1987,1986,1985,1984,1983,1982,1981,1980,1979,1978,1977,1976,1975,1974,1973,1972
This statistics in other country:
AlbaniaAlgeriaAngolaArab WorldArgentinaArmeniaAustraliaAustriaAzerbaijanBahrainBangladeshBelarusBelgiumBeninBoliviaBosnia and HerzegovinaBotswanaBrazilBrunei DarussalamBulgariaCambodiaCameroonCanadaCaribbean small statesCentral Europe and the BalticsChileChinaColombiaCongo, Dem. Rep.Congo, Rep.Costa RicaCote d'IvoireCroatiaCubaCuracaoCyprusCzech RepublicDenmarkDominican RepublicEarly-demographic dividendEast Asia & PacificEast Asia & Pacific (excluding high income)East Asia & Pacific (IDA & IBRD countries)EcuadorEgypt, Arab Rep.El SalvadorEritreaEstoniaEthiopiaEuro areaEurope & Central AsiaEurope & Central Asia (excluding high income)Europe & Central Asia (IDA & IBRD countries)European UnionFinlandFragile and conflict affected situationsFranceGabonGeorgiaGermanyGhanaGibraltarGreeceGuatemalaHaitiHeavily indebted poor countries (HIPC)High incomeHondurasHong Kong SAR, ChinaHungaryIBRD onlyIcelandIDA & IBRD totalIDA blendIDA onlyIDA totalIndiaIndonesiaIran, Islamic Rep.IraqIrelandIsraelItalyJamaicaJapanJordanKazakhstanKenyaKorea, Dem. People’s Rep.Korea, Rep.KosovoKuwaitKyrgyz RepublicLate-demographic dividendLatin America & Caribbean Latin America & Caribbean (excluding high income)Latin America & the Caribbean (IDA & IBRD countries)LatviaLeast developed countries: UN classificationLebanonLibyaLithuaniaLow & middle incomeLow incomeLower middle incomeLuxembourgMacedonia, FYRMalaysiaMaltaMauritiusMexicoMiddle East & North AfricaMiddle East & North Africa (excluding high income)Middle East & North Africa (IDA & IBRD countries)Middle incomeMoldovaMongoliaMontenegroMoroccoMozambiqueMyanmarNamibiaNepalNetherlandsNew ZealandNicaraguaNigerNigeriaNorth AmericaNorwayOECD membersOmanOther small statesPakistanPanamaParaguayPeruPhilippinesPolandPortugalPost-demographic dividendPre-demographic dividendQatarRomaniaRussian FederationSaudi ArabiaSenegalSerbiaSingaporeSlovak RepublicSloveniaSmall statesSouth AfricaSouth AsiaSouth Asia (IDA & IBRD)South SudanSpainSri LankaSub-Saharan Africa Sub-Saharan Africa (excluding high income)Sub-Saharan Africa (IDA & IBRD countries)SudanSwedenSwitzerlandSyrian Arab RepublicTajikistanTanzaniaThailandTogoTrinidad and TobagoTunisiaTurkeyTurkmenistanUkraineUnited Arab EmiratesUnited KingdomUnited StatesUpper middle incomeUruguayUzbekistanVenezuela, RBVietnamWorldYemen, Rep.ZambiaZimbabwe Timeline:
This timeline shows a graph from 1972 to 2014 of Jamaica. No data until 1971. Number of actual observations by date: 43.
Source name:
World Development Indicators
Source organization:
IEA Statistics © OECD/IEA 2014 (http://www.iea.org/stats/index.asp), subject to https://www.iea.org/t&c/termsandconditions/
Categories, topics:
Environment
Last updated:
apr 23, 2017
Indicators value changes by year
Minimum:
13.303
jan 1, 1981
Maximum:
29.114
jan 1, 1972
At the date of observation
Value
Absolute change
Change from previous value
jan 1, 1972
29.114
+29.114
0.0%
jan 1, 1973
24.671
-4.443
-15.26%
jan 1, 1974
20.471
-4.2
-17.02%
jan 1, 1975
20.243
-0.229
-1.12%
jan 1, 1976
15.973
-4.27
-21.09%
jan 1, 1977
18.065
+2.091
13.09%
jan 1, 1978
14.327
-3.737
-20.69%
jan 1, 1979
13.571
-0.756
-5.28%
jan 1, 1980
13.857
+0.286
2.11%
jan 1, 1981
13.303
-0.554
-4.0%
jan 1, 1982
14.11
+0.808
6.07%
jan 1, 1983
17.415
+3.304
23.42%
jan 1, 1984
16.275
-1.14
-6.55%
jan 1, 1985
15.709
-0.566
-3.48%
jan 1, 1986
17.559
+1.85
11.78%
jan 1, 1987
18.326
+0.767
4.37%
jan 1, 1988
20.043
+1.717
9.37%
jan 1, 1989
21.561
+1.518
7.57%
jan 1, 1990
15.873
-5.688
-26.38%
jan 1, 1991
14.917
-0.956
-6.02%
jan 1, 1992
14.286
-0.631
-4.23%
jan 1, 1993
13.527
-0.759
-5.31%
jan 1, 1994
14.321
+0.794
5.87%
jan 1, 1995
14.338
+0.017
0.12%
jan 1, 1996
16.627
+2.289
15.96%
jan 1, 1997
18.358
+1.731
10.41%
jan 1, 1998
18.973
+0.615
3.35%
jan 1, 1999
19.45
+0.477
2.51%
jan 1, 2000
19.815
+0.365
1.88%
jan 1, 2001
19.714
-0.101
-0.51%
jan 1, 2002
19.145
-0.569
-2.89%
jan 1, 2003
20.762
+1.618
8.45%
jan 1, 2004
20.136
-0.626
-3.02%
jan 1, 2005
20.683
+0.547
2.72%
jan 1, 2006
21.498
+0.815
3.94%
jan 1, 2007
18.313
-3.185
-14.81%
jan 1, 2008
17.617
-0.696
-3.8%
jan 1, 2009
21.009
+3.392
19.26%
jan 1, 2010
26.667
+5.657
26.93%
jan 1, 2011
26.84
+0.173
0.65%
jan 1, 2012
25.171
-1.669
-6.22%
jan 1, 2013
24.251
-0.92
-3.65%
jan 1, 2014
24.161
-0.09
-0.37%
Ranking of countries by current statistics by years


Comments: