29
/
en
AIzaSyAYiBZKx7MnpbEhh9jyipgxe19OcubqV5w
April 1, 2024
201343
Morocco
MAR
true
2
1
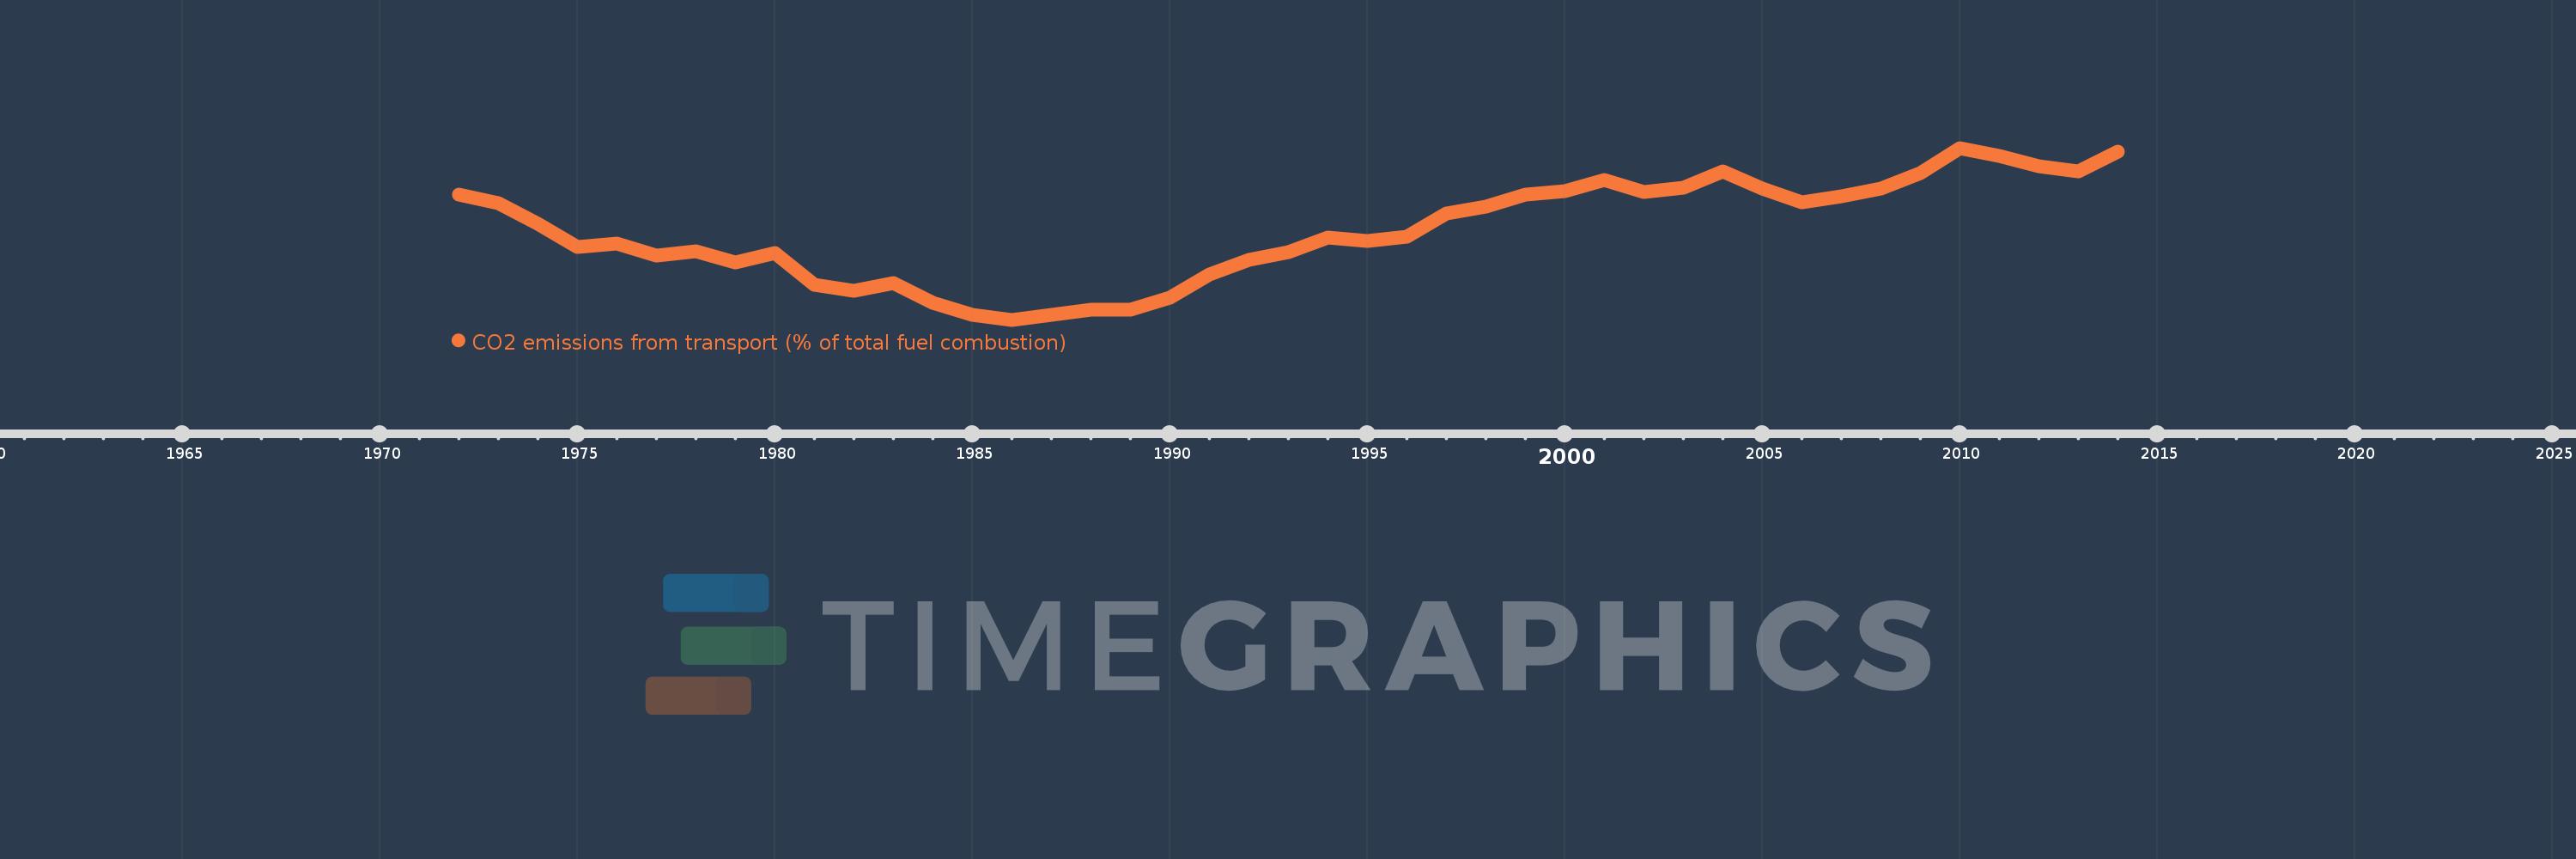
CO2 emissions from transport (% of total fuel combustion)
2014,2013,2012,2011,2010,2009,2008,2007,2006,2005,2004,2003,2002,2001,2000,1999,1998,1997,1996,1995,1994,1993,1992,1991,1990,1989,1988,1987,1986,1985,1984,1983,1982,1981,1980,1979,1978,1977,1976,1975,1974,1973,1972
This statistics in other country:
AlbaniaAlgeriaAngolaArab WorldArgentinaArmeniaAustraliaAustriaAzerbaijanBahrainBangladeshBelarusBelgiumBeninBoliviaBosnia and HerzegovinaBotswanaBrazilBrunei DarussalamBulgariaCambodiaCameroonCanadaCaribbean small statesCentral Europe and the BalticsChileChinaColombiaCongo, Dem. Rep.Congo, Rep.Costa RicaCote d'IvoireCroatiaCubaCuracaoCyprusCzech RepublicDenmarkDominican RepublicEarly-demographic dividendEast Asia & PacificEast Asia & Pacific (excluding high income)East Asia & Pacific (IDA & IBRD countries)EcuadorEgypt, Arab Rep.El SalvadorEritreaEstoniaEthiopiaEuro areaEurope & Central AsiaEurope & Central Asia (excluding high income)Europe & Central Asia (IDA & IBRD countries)European UnionFinlandFragile and conflict affected situationsFranceGabonGeorgiaGermanyGhanaGibraltarGreeceGuatemalaHaitiHeavily indebted poor countries (HIPC)High incomeHondurasHong Kong SAR, ChinaHungaryIBRD onlyIcelandIDA & IBRD totalIDA blendIDA onlyIDA totalIndiaIndonesiaIran, Islamic Rep.IraqIrelandIsraelItalyJamaicaJapanJordanKazakhstanKenyaKorea, Dem. People’s Rep.Korea, Rep.KosovoKuwaitKyrgyz RepublicLate-demographic dividendLatin America & Caribbean Latin America & Caribbean (excluding high income)Latin America & the Caribbean (IDA & IBRD countries)LatviaLeast developed countries: UN classificationLebanonLibyaLithuaniaLow & middle incomeLow incomeLower middle incomeLuxembourgMacedonia, FYRMalaysiaMaltaMauritiusMexicoMiddle East & North AfricaMiddle East & North Africa (excluding high income)Middle East & North Africa (IDA & IBRD countries)Middle incomeMoldovaMongoliaMontenegroMoroccoMozambiqueMyanmarNamibiaNepalNetherlandsNew ZealandNicaraguaNigerNigeriaNorth AmericaNorwayOECD membersOmanOther small statesPakistanPanamaParaguayPeruPhilippinesPolandPortugalPost-demographic dividendPre-demographic dividendQatarRomaniaRussian FederationSaudi ArabiaSenegalSerbiaSingaporeSlovak RepublicSloveniaSmall statesSouth AfricaSouth AsiaSouth Asia (IDA & IBRD)South SudanSpainSri LankaSub-Saharan Africa Sub-Saharan Africa (excluding high income)Sub-Saharan Africa (IDA & IBRD countries)SudanSwedenSwitzerlandSyrian Arab RepublicTajikistanTanzaniaThailandTogoTrinidad and TobagoTunisiaTurkeyTurkmenistanUkraineUnited Arab EmiratesUnited KingdomUnited StatesUpper middle incomeUruguayUzbekistanVenezuela, RBVietnamWorldYemen, Rep.ZambiaZimbabwe Timeline:
This timeline shows a graph from 1972 to 2014 of Morocco. No data until 1971. Number of actual observations by date: 43.
Source name:
World Development Indicators
Source organization:
IEA Statistics © OECD/IEA 2014 (http://www.iea.org/stats/index.asp), subject to https://www.iea.org/t&c/termsandconditions/
Categories, topics:
Environment
Last updated:
apr 23, 2017
Indicators value changes by year
Minimum:
16.042
jan 1, 1986
At the date of observation
Value
Absolute change
Change from previous value
jan 1, 1972
26.444
+26.444
0.0%
jan 1, 1973
25.726
-0.718
-2.71%
jan 1, 1974
24.01
-1.717
-6.67%
jan 1, 1975
22.088
-1.922
-8.0%
jan 1, 1976
22.36
+0.272
1.23%
jan 1, 1977
21.395
-0.965
-4.32%
jan 1, 1978
21.735
+0.34
1.59%
jan 1, 1979
20.82
-0.915
-4.21%
jan 1, 1980
21.605
+0.785
3.77%
jan 1, 1981
18.933
-2.673
-12.37%
jan 1, 1982
18.47
-0.462
-2.44%
jan 1, 1983
19.09
+0.62
3.36%
jan 1, 1984
17.462
-1.628
-8.53%
jan 1, 1985
16.443
-1.02
-5.84%
jan 1, 1986
16.042
-0.401
-2.44%
jan 1, 1987
16.478
+0.436
2.72%
jan 1, 1988
16.841
+0.364
2.21%
jan 1, 1989
16.871
+0.029
0.17%
jan 1, 1990
17.877
+1.007
5.97%
jan 1, 1991
19.796
+1.919
10.73%
jan 1, 1992
21.019
+1.223
6.18%
jan 1, 1993
21.645
+0.625
2.98%
jan 1, 1994
22.855
+1.21
5.59%
jan 1, 1995
22.569
-0.286
-1.25%
jan 1, 1996
22.938
+0.369
1.64%
jan 1, 1997
24.864
+1.926
8.39%
jan 1, 1998
25.428
+0.564
2.27%
jan 1, 1999
26.398
+0.97
3.81%
jan 1, 2000
26.685
+0.287
1.09%
jan 1, 2001
27.657
+0.972
3.64%
jan 1, 2002
26.654
-1.003
-3.63%
jan 1, 2003
26.973
+0.318
1.19%
jan 1, 2004
28.342
+1.37
5.08%
jan 1, 2005
26.933
-1.41
-4.97%
jan 1, 2006
25.804
-1.129
-4.19%
jan 1, 2007
26.309
+0.505
1.96%
jan 1, 2008
26.911
+0.602
2.29%
jan 1, 2009
28.232
+1.321
4.91%
jan 1, 2010
30.29
+2.058
7.29%
jan 1, 2011
29.6
-0.69
-2.28%
jan 1, 2012
28.74
-0.86
-2.91%
jan 1, 2013
28.366
-0.373
-1.3%
jan 1, 2014
30.016
+1.65
5.82%
Ranking of countries by current statistics by years


Comments: