29
/
en
AIzaSyAYiBZKx7MnpbEhh9jyipgxe19OcubqV5w
April 1, 2024
216160
Pakistan
PAK
true
2
1
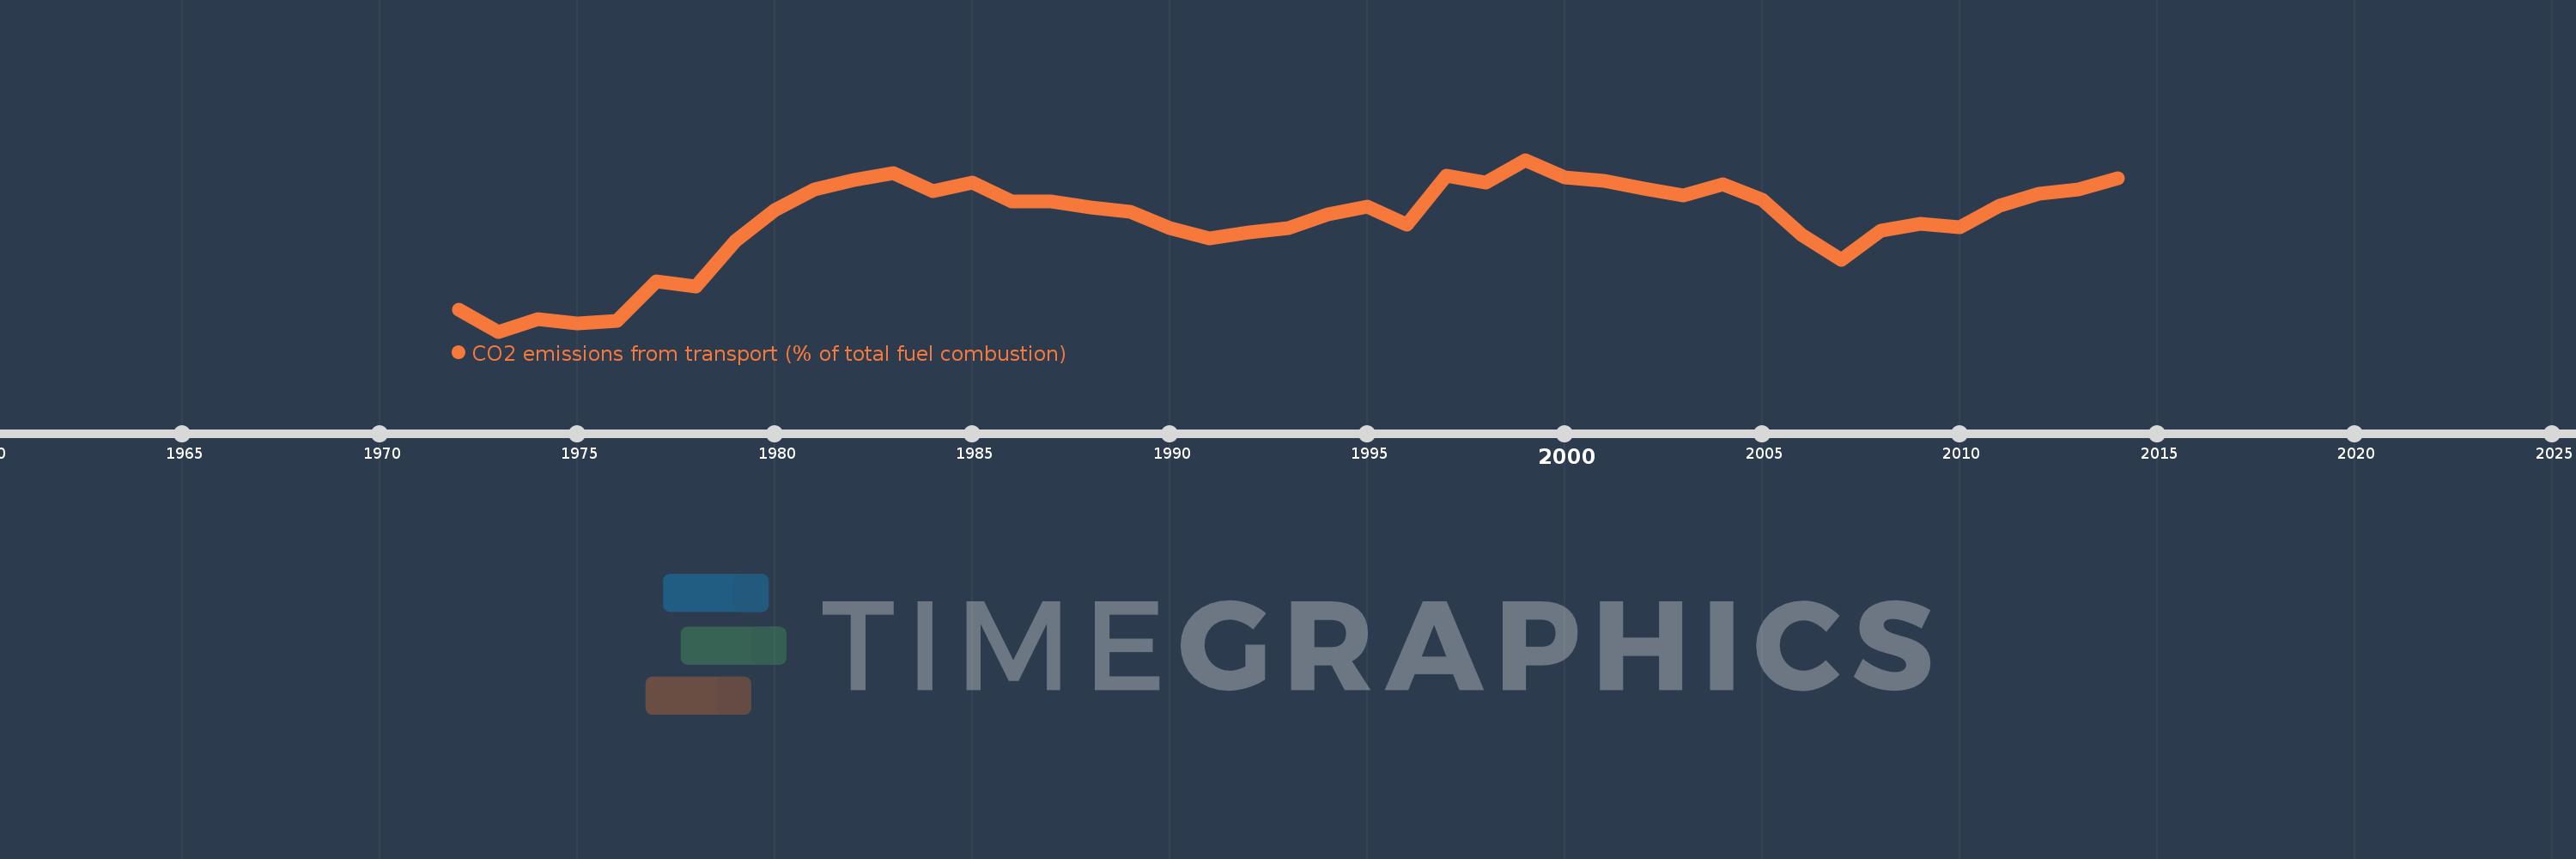
CO2 emissions from transport (% of total fuel combustion)
2014,2013,2012,2011,2010,2009,2008,2007,2006,2005,2004,2003,2002,2001,2000,1999,1998,1997,1996,1995,1994,1993,1992,1991,1990,1989,1988,1987,1986,1985,1984,1983,1982,1981,1980,1979,1978,1977,1976,1975,1974,1973,1972
This statistics in other country:
AlbaniaAlgeriaAngolaArab WorldArgentinaArmeniaAustraliaAustriaAzerbaijanBahrainBangladeshBelarusBelgiumBeninBoliviaBosnia and HerzegovinaBotswanaBrazilBrunei DarussalamBulgariaCambodiaCameroonCanadaCaribbean small statesCentral Europe and the BalticsChileChinaColombiaCongo, Dem. Rep.Congo, Rep.Costa RicaCote d'IvoireCroatiaCubaCuracaoCyprusCzech RepublicDenmarkDominican RepublicEarly-demographic dividendEast Asia & PacificEast Asia & Pacific (excluding high income)East Asia & Pacific (IDA & IBRD countries)EcuadorEgypt, Arab Rep.El SalvadorEritreaEstoniaEthiopiaEuro areaEurope & Central AsiaEurope & Central Asia (excluding high income)Europe & Central Asia (IDA & IBRD countries)European UnionFinlandFragile and conflict affected situationsFranceGabonGeorgiaGermanyGhanaGibraltarGreeceGuatemalaHaitiHeavily indebted poor countries (HIPC)High incomeHondurasHong Kong SAR, ChinaHungaryIBRD onlyIcelandIDA & IBRD totalIDA blendIDA onlyIDA totalIndiaIndonesiaIran, Islamic Rep.IraqIrelandIsraelItalyJamaicaJapanJordanKazakhstanKenyaKorea, Dem. People’s Rep.Korea, Rep.KosovoKuwaitKyrgyz RepublicLate-demographic dividendLatin America & Caribbean Latin America & Caribbean (excluding high income)Latin America & the Caribbean (IDA & IBRD countries)LatviaLeast developed countries: UN classificationLebanonLibyaLithuaniaLow & middle incomeLow incomeLower middle incomeLuxembourgMacedonia, FYRMalaysiaMaltaMauritiusMexicoMiddle East & North AfricaMiddle East & North Africa (excluding high income)Middle East & North Africa (IDA & IBRD countries)Middle incomeMoldovaMongoliaMontenegroMoroccoMozambiqueMyanmarNamibiaNepalNetherlandsNew ZealandNicaraguaNigerNigeriaNorth AmericaNorwayOECD membersOmanOther small statesPakistanPanamaParaguayPeruPhilippinesPolandPortugalPost-demographic dividendPre-demographic dividendQatarRomaniaRussian FederationSaudi ArabiaSenegalSerbiaSingaporeSlovak RepublicSloveniaSmall statesSouth AfricaSouth AsiaSouth Asia (IDA & IBRD)South SudanSpainSri LankaSub-Saharan Africa Sub-Saharan Africa (excluding high income)Sub-Saharan Africa (IDA & IBRD countries)SudanSwedenSwitzerlandSyrian Arab RepublicTajikistanTanzaniaThailandTogoTrinidad and TobagoTunisiaTurkeyTurkmenistanUkraineUnited Arab EmiratesUnited KingdomUnited StatesUpper middle incomeUruguayUzbekistanVenezuela, RBVietnamWorldYemen, Rep.ZambiaZimbabwe Timeline:
This timeline shows a graph from 1972 to 2014 of Pakistan. No data until 1971. Number of actual observations by date: 43.
Source name:
World Development Indicators
Source organization:
IEA Statistics © OECD/IEA 2014 (http://www.iea.org/stats/index.asp), subject to https://www.iea.org/t&c/termsandconditions/
Categories, topics:
Environment
Last updated:
apr 23, 2017
Indicators value changes by year
Minimum:
18.625
jan 1, 1973
Maximum:
29.701
jan 1, 1999
At the date of observation
Value
Absolute change
Change from previous value
jan 1, 1972
20.038
+20.038
0.0%
jan 1, 1973
18.625
-1.413
-7.05%
jan 1, 1974
19.435
+0.81
4.35%
jan 1, 1975
19.164
-0.27
-1.39%
jan 1, 1976
19.319
+0.155
0.81%
jan 1, 1977
21.844
+2.525
13.07%
jan 1, 1978
21.527
-0.317
-1.45%
jan 1, 1979
24.483
+2.956
13.73%
jan 1, 1980
26.469
+1.986
8.11%
jan 1, 1981
27.766
+1.297
4.9%
jan 1, 1982
28.408
+0.642
2.31%
jan 1, 1983
28.865
+0.457
1.61%
jan 1, 1984
27.662
-1.204
-4.17%
jan 1, 1985
28.221
+0.56
2.02%
jan 1, 1986
27.021
-1.2
-4.25%
jan 1, 1987
26.994
-0.027
-0.1%
jan 1, 1988
26.649
-0.345
-1.28%
jan 1, 1989
26.367
-0.282
-1.06%
jan 1, 1990
25.272
-1.095
-4.15%
jan 1, 1991
24.625
-0.648
-2.56%
jan 1, 1992
25.013
+0.388
1.58%
jan 1, 1993
25.279
+0.265
1.06%
jan 1, 1994
26.173
+0.894
3.54%
jan 1, 1995
26.683
+0.51
1.95%
jan 1, 1996
25.536
-1.147
-4.3%
jan 1, 1997
28.697
+3.16
12.37%
jan 1, 1998
28.223
-0.474
-1.65%
jan 1, 1999
29.701
+1.478
5.24%
jan 1, 2000
28.561
-1.14
-3.84%
jan 1, 2001
28.335
-0.226
-0.79%
jan 1, 2002
27.866
-0.469
-1.65%
jan 1, 2003
27.417
-0.449
-1.61%
jan 1, 2004
28.112
+0.695
2.53%
jan 1, 2005
27.103
-1.009
-3.59%
jan 1, 2006
24.831
-2.272
-8.38%
jan 1, 2007
23.268
-1.563
-6.29%
jan 1, 2008
25.131
+1.862
8.0%
jan 1, 2009
25.549
+0.418
1.66%
jan 1, 2010
25.349
-0.2
-0.78%
jan 1, 2011
26.743
+1.394
5.5%
jan 1, 2012
27.537
+0.794
2.97%
jan 1, 2013
27.788
+0.251
0.91%
jan 1, 2014
28.51
+0.722
2.6%
Ranking of countries by current statistics by years


Comments: