29
/
en
AIzaSyAYiBZKx7MnpbEhh9jyipgxe19OcubqV5w
April 1, 2024
61424
Upper middle income
UMC
false
2
1
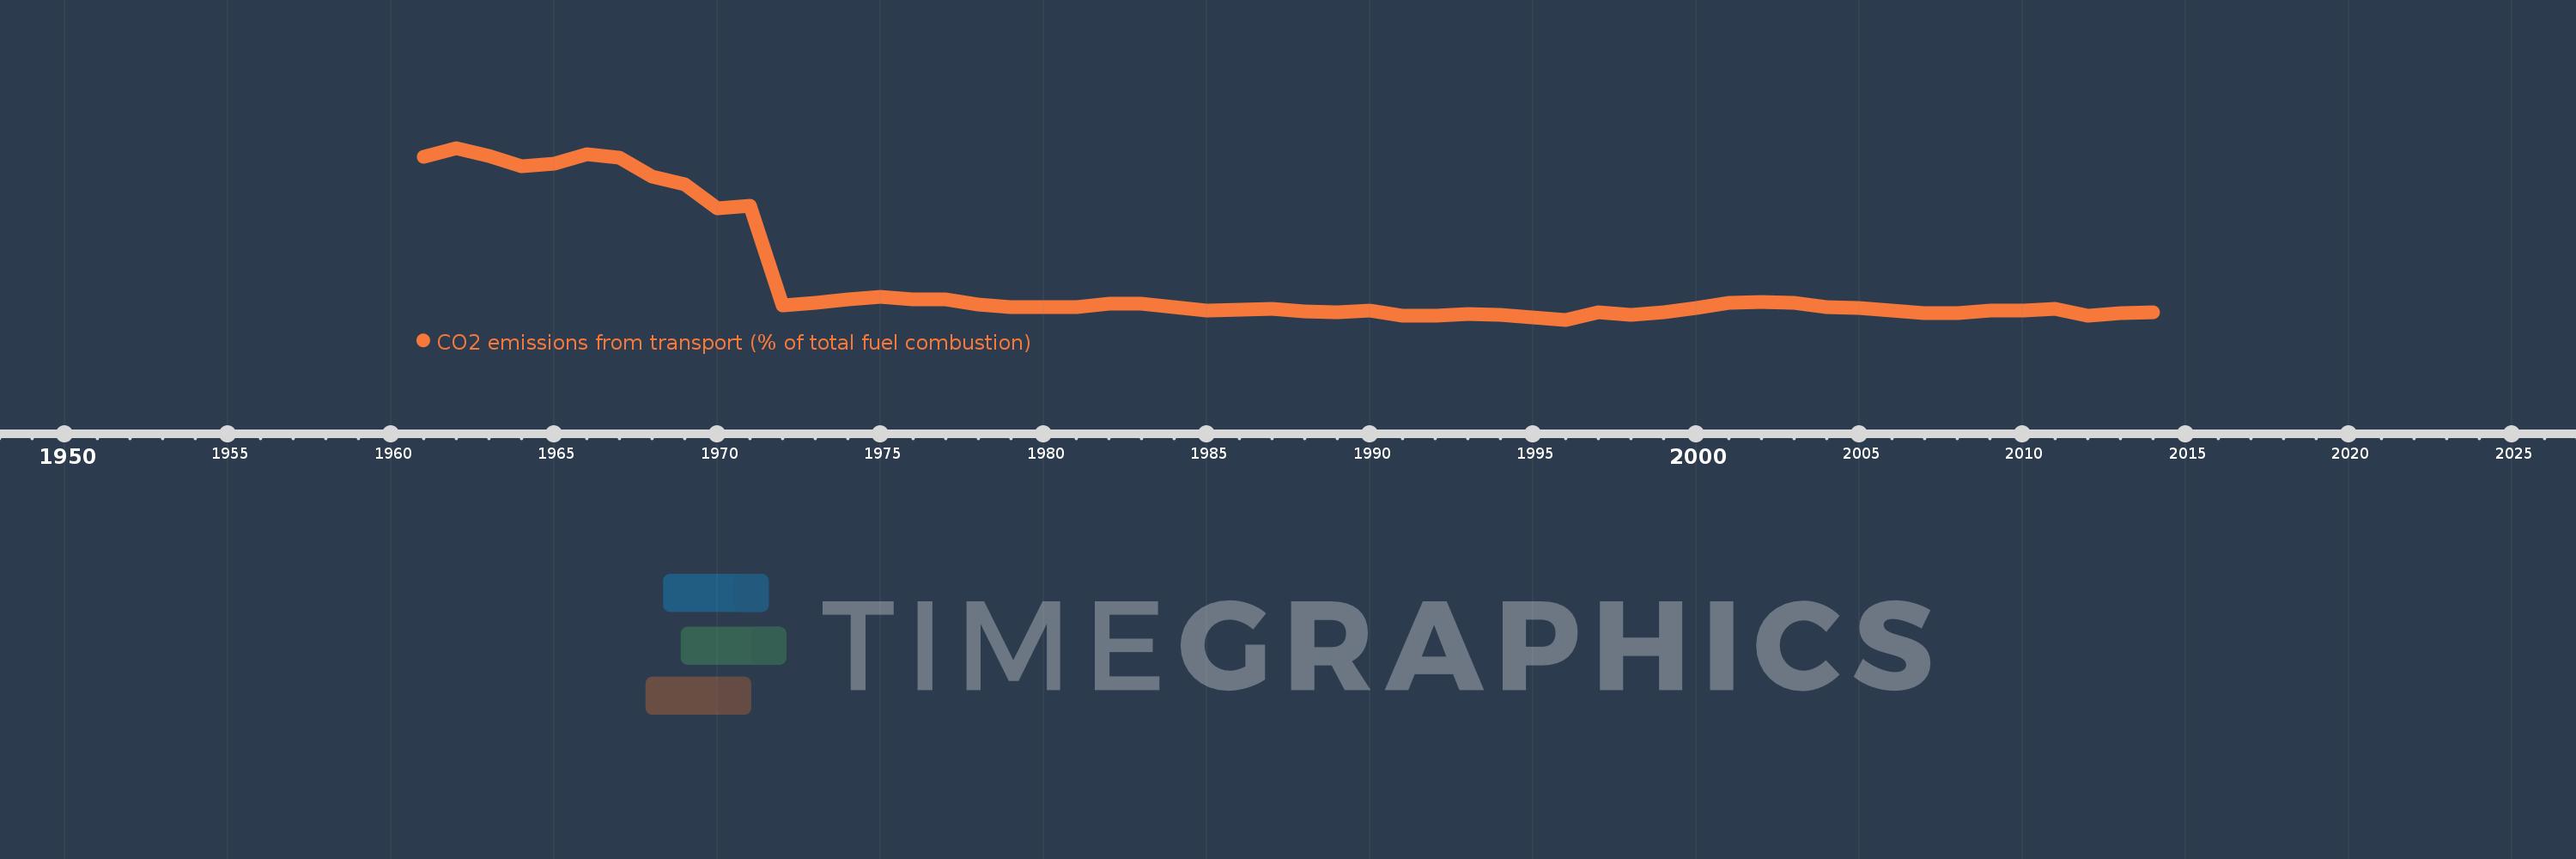
CO2 emissions from transport (% of total fuel combustion)
2014,2013,2012,2011,2010,2009,2008,2007,2006,2005,2004,2003,2002,2001,2000,1999,1998,1997,1996,1995,1994,1993,1992,1991,1990,1989,1988,1987,1986,1985,1984,1983,1982,1981,1980,1979,1978,1977,1976,1975,1974,1973,1972,1971,1970,1969,1968,1967,1966,1965,1964,1963,1962,1961
This statistics in other country:
AlbaniaAlgeriaAngolaArab WorldArgentinaArmeniaAustraliaAustriaAzerbaijanBahrainBangladeshBelarusBelgiumBeninBoliviaBosnia and HerzegovinaBotswanaBrazilBrunei DarussalamBulgariaCambodiaCameroonCanadaCaribbean small statesCentral Europe and the BalticsChileChinaColombiaCongo, Dem. Rep.Congo, Rep.Costa RicaCote d'IvoireCroatiaCubaCuracaoCyprusCzech RepublicDenmarkDominican RepublicEarly-demographic dividendEast Asia & PacificEast Asia & Pacific (excluding high income)East Asia & Pacific (IDA & IBRD countries)EcuadorEgypt, Arab Rep.El SalvadorEritreaEstoniaEthiopiaEuro areaEurope & Central AsiaEurope & Central Asia (excluding high income)Europe & Central Asia (IDA & IBRD countries)European UnionFinlandFragile and conflict affected situationsFranceGabonGeorgiaGermanyGhanaGibraltarGreeceGuatemalaHaitiHeavily indebted poor countries (HIPC)High incomeHondurasHong Kong SAR, ChinaHungaryIBRD onlyIcelandIDA & IBRD totalIDA blendIDA onlyIDA totalIndiaIndonesiaIran, Islamic Rep.IraqIrelandIsraelItalyJamaicaJapanJordanKazakhstanKenyaKorea, Dem. People’s Rep.Korea, Rep.KosovoKuwaitKyrgyz RepublicLate-demographic dividendLatin America & Caribbean Latin America & Caribbean (excluding high income)Latin America & the Caribbean (IDA & IBRD countries)LatviaLeast developed countries: UN classificationLebanonLibyaLithuaniaLow & middle incomeLow incomeLower middle incomeLuxembourgMacedonia, FYRMalaysiaMaltaMauritiusMexicoMiddle East & North AfricaMiddle East & North Africa (excluding high income)Middle East & North Africa (IDA & IBRD countries)Middle incomeMoldovaMongoliaMontenegroMoroccoMozambiqueMyanmarNamibiaNepalNetherlandsNew ZealandNicaraguaNigerNigeriaNorth AmericaNorwayOECD membersOmanOther small statesPakistanPanamaParaguayPeruPhilippinesPolandPortugalPost-demographic dividendPre-demographic dividendQatarRomaniaRussian FederationSaudi ArabiaSenegalSerbiaSingaporeSlovak RepublicSloveniaSmall statesSouth AfricaSouth AsiaSouth Asia (IDA & IBRD)South SudanSpainSri LankaSub-Saharan Africa Sub-Saharan Africa (excluding high income)Sub-Saharan Africa (IDA & IBRD countries)SudanSwedenSwitzerlandSyrian Arab RepublicTajikistanTanzaniaThailandTogoTrinidad and TobagoTunisiaTurkeyTurkmenistanUkraineUnited Arab EmiratesUnited KingdomUnited StatesUpper middle incomeUruguayUzbekistanVenezuela, RBVietnamWorldYemen, Rep.ZambiaZimbabwe Timeline:
This timeline shows a graph from 1961 to 2014 of Upper middle income. No data until 1960. Number of actual observations by date: 54.
Source name:
World Development Indicators
Source organization:
IEA Statistics © OECD/IEA 2014 (http://www.iea.org/stats/index.asp), subject to https://www.iea.org/t&c/termsandconditions/
Categories, topics:
Environment
Last updated:
apr 23, 2017
Indicators value changes by year
Minimum:
13.353
jan 1, 1996
Maximum:
33.943
jan 1, 1962
At the date of observation
Value
Absolute change
Change from previous value
jan 1, 1961
32.916
+32.916
0.0%
jan 1, 1962
33.943
+1.027
3.12%
jan 1, 1963
33.028
-0.915
-2.7%
jan 1, 1964
31.789
-1.238
-3.75%
jan 1, 1965
32.059
+0.27
0.85%
jan 1, 1966
33.192
+1.133
3.53%
jan 1, 1967
32.807
-0.385
-1.16%
jan 1, 1968
30.494
-2.314
-7.05%
jan 1, 1969
29.57
-0.923
-3.03%
jan 1, 1970
26.682
-2.889
-9.77%
jan 1, 1971
26.977
+0.295
1.1%
jan 1, 1972
15.12
-11.857
-43.95%
jan 1, 1973
15.399
+0.278
1.84%
jan 1, 1974
15.797
+0.398
2.59%
jan 1, 1975
16.103
+0.306
1.94%
jan 1, 1976
15.793
-0.31
-1.92%
jan 1, 1977
15.746
-0.047
-0.3%
jan 1, 1978
15.178
-0.568
-3.61%
jan 1, 1979
14.825
-0.354
-2.33%
jan 1, 1980
14.857
+0.032
0.22%
jan 1, 1981
14.881
+0.024
0.16%
jan 1, 1982
15.316
+0.435
2.92%
jan 1, 1983
15.28
-0.035
-0.23%
jan 1, 1984
14.852
-0.428
-2.8%
jan 1, 1985
14.497
-0.355
-2.39%
jan 1, 1986
14.595
+0.098
0.68%
jan 1, 1987
14.655
+0.061
0.41%
jan 1, 1988
14.388
-0.267
-1.82%
jan 1, 1989
14.23
-0.158
-1.1%
jan 1, 1990
14.48
+0.25
1.75%
jan 1, 1991
13.795
-0.685
-4.73%
jan 1, 1992
13.834
+0.039
0.29%
jan 1, 1993
14.072
+0.238
1.72%
jan 1, 1994
13.904
-0.168
-1.19%
jan 1, 1995
13.609
-0.295
-2.12%
jan 1, 1996
13.353
-0.256
-1.88%
jan 1, 1997
14.233
+0.879
6.59%
jan 1, 1998
13.944
-0.288
-2.03%
jan 1, 1999
14.219
+0.275
1.97%
jan 1, 2000
14.78
+0.561
3.95%
jan 1, 2001
15.355
+0.574
3.88%
jan 1, 2002
15.443
+0.088
0.57%
jan 1, 2003
15.417
-0.026
-0.17%
jan 1, 2004
14.87
-0.546
-3.54%
jan 1, 2005
14.803
-0.068
-0.45%
jan 1, 2006
14.46
-0.343
-2.31%
jan 1, 2007
14.15
-0.31
-2.15%
jan 1, 2008
14.177
+0.028
0.2%
jan 1, 2009
14.444
+0.267
1.88%
jan 1, 2010
14.429
-0.015
-0.11%
jan 1, 2011
14.667
+0.238
1.65%
jan 1, 2012
13.797
-0.87
-5.93%
jan 1, 2013
14.182
+0.385
2.79%
jan 1, 2014
14.219
+0.037
0.26%
Ranking of countries by current statistics by years


Comments: