29
/
en
AIzaSyAYiBZKx7MnpbEhh9jyipgxe19OcubqV5w
April 1, 2024
152328
Hungary
HUN
true
2
1
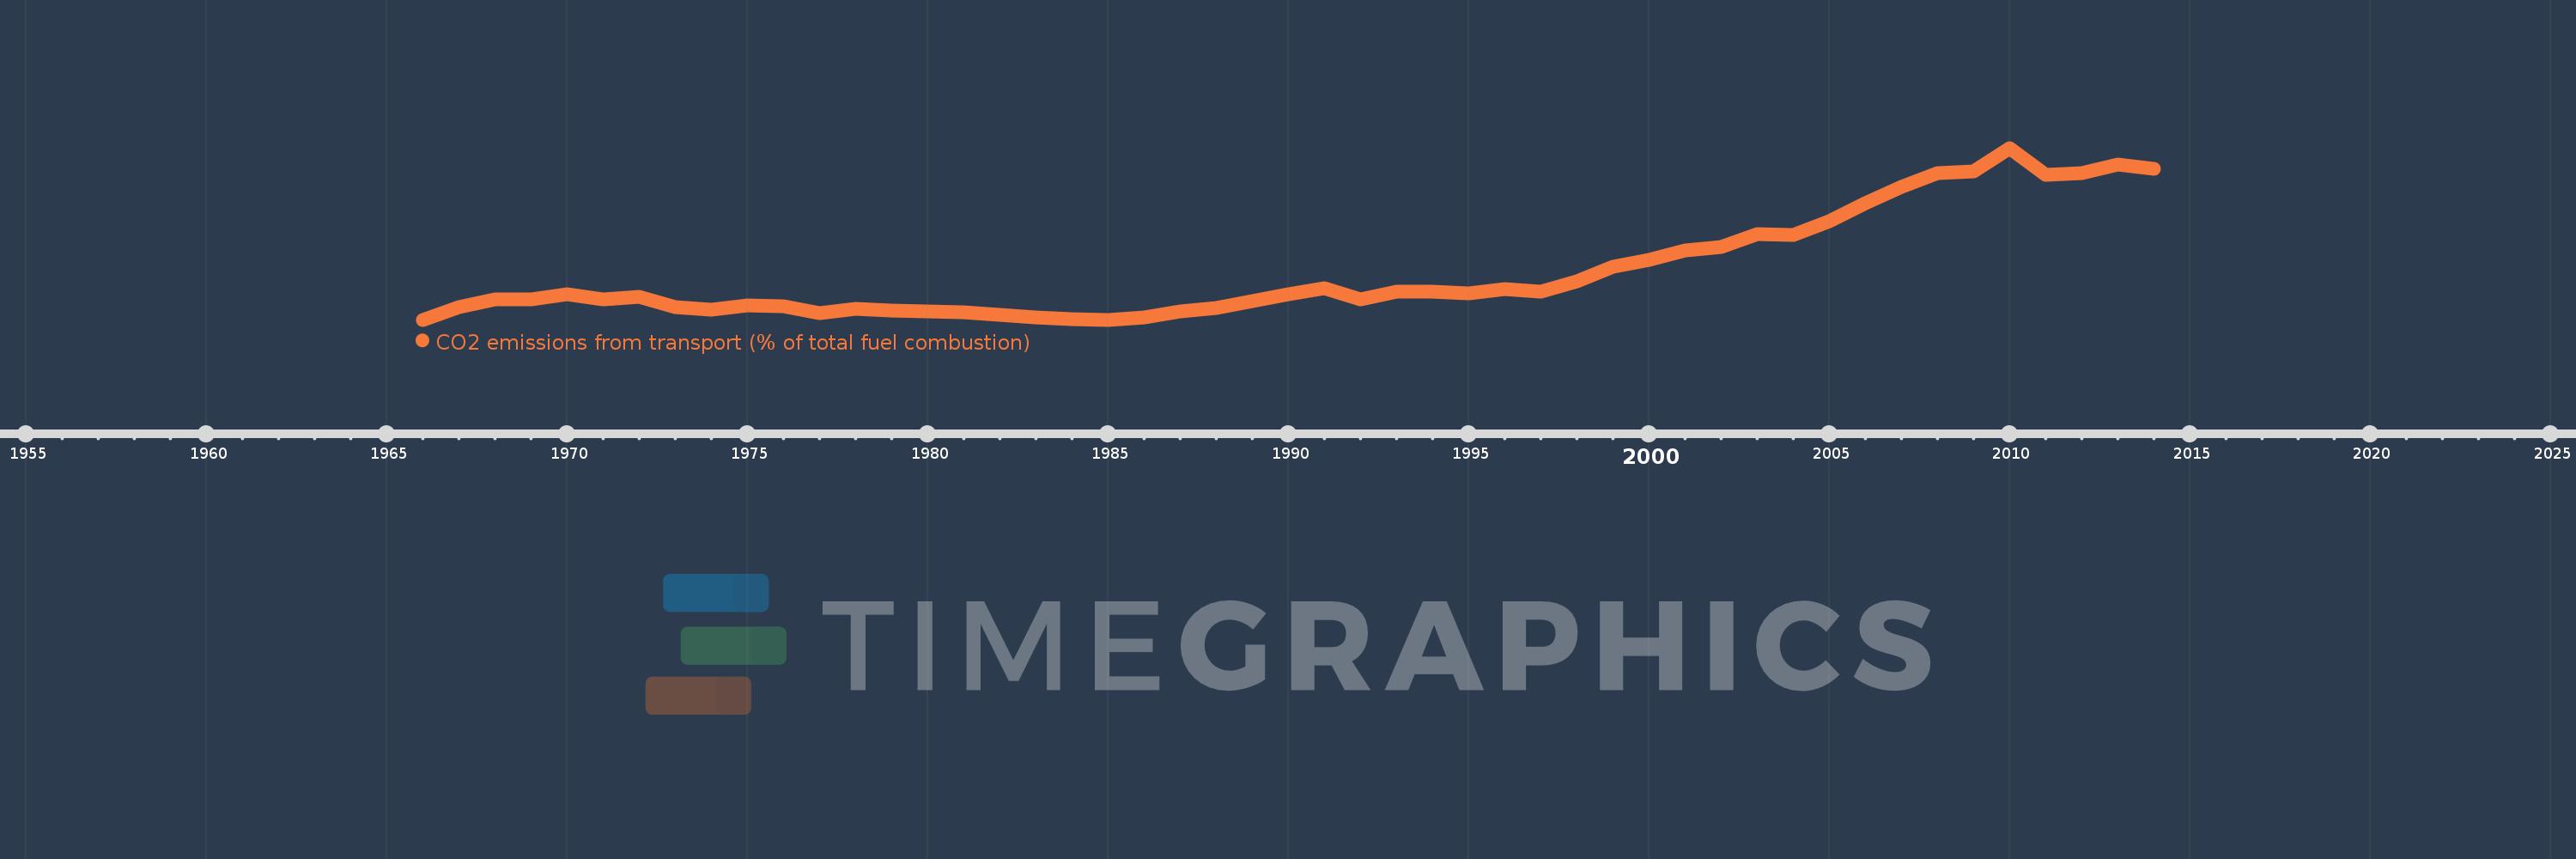
CO2 emissions from transport (% of total fuel combustion)
2014,2013,2012,2011,2010,2009,2008,2007,2006,2005,2004,2003,2002,2001,2000,1999,1998,1997,1996,1995,1994,1993,1992,1991,1990,1989,1988,1987,1986,1985,1984,1983,1982,1981,1980,1979,1978,1977,1976,1975,1974,1973,1972,1971,1970,1969,1968,1967,1966
This statistics in other country:
AlbaniaAlgeriaAngolaArab WorldArgentinaArmeniaAustraliaAustriaAzerbaijanBahrainBangladeshBelarusBelgiumBeninBoliviaBosnia and HerzegovinaBotswanaBrazilBrunei DarussalamBulgariaCambodiaCameroonCanadaCaribbean small statesCentral Europe and the BalticsChileChinaColombiaCongo, Dem. Rep.Congo, Rep.Costa RicaCote d'IvoireCroatiaCubaCuracaoCyprusCzech RepublicDenmarkDominican RepublicEarly-demographic dividendEast Asia & PacificEast Asia & Pacific (excluding high income)East Asia & Pacific (IDA & IBRD countries)EcuadorEgypt, Arab Rep.El SalvadorEritreaEstoniaEthiopiaEuro areaEurope & Central AsiaEurope & Central Asia (excluding high income)Europe & Central Asia (IDA & IBRD countries)European UnionFinlandFragile and conflict affected situationsFranceGabonGeorgiaGermanyGhanaGibraltarGreeceGuatemalaHaitiHeavily indebted poor countries (HIPC)High incomeHondurasHong Kong SAR, ChinaHungaryIBRD onlyIcelandIDA & IBRD totalIDA blendIDA onlyIDA totalIndiaIndonesiaIran, Islamic Rep.IraqIrelandIsraelItalyJamaicaJapanJordanKazakhstanKenyaKorea, Dem. People’s Rep.Korea, Rep.KosovoKuwaitKyrgyz RepublicLate-demographic dividendLatin America & Caribbean Latin America & Caribbean (excluding high income)Latin America & the Caribbean (IDA & IBRD countries)LatviaLeast developed countries: UN classificationLebanonLibyaLithuaniaLow & middle incomeLow incomeLower middle incomeLuxembourgMacedonia, FYRMalaysiaMaltaMauritiusMexicoMiddle East & North AfricaMiddle East & North Africa (excluding high income)Middle East & North Africa (IDA & IBRD countries)Middle incomeMoldovaMongoliaMontenegroMoroccoMozambiqueMyanmarNamibiaNepalNetherlandsNew ZealandNicaraguaNigerNigeriaNorth AmericaNorwayOECD membersOmanOther small statesPakistanPanamaParaguayPeruPhilippinesPolandPortugalPost-demographic dividendPre-demographic dividendQatarRomaniaRussian FederationSaudi ArabiaSenegalSerbiaSingaporeSlovak RepublicSloveniaSmall statesSouth AfricaSouth AsiaSouth Asia (IDA & IBRD)South SudanSpainSri LankaSub-Saharan Africa Sub-Saharan Africa (excluding high income)Sub-Saharan Africa (IDA & IBRD countries)SudanSwedenSwitzerlandSyrian Arab RepublicTajikistanTanzaniaThailandTogoTrinidad and TobagoTunisiaTurkeyTurkmenistanUkraineUnited Arab EmiratesUnited KingdomUnited StatesUpper middle incomeUruguayUzbekistanVenezuela, RBVietnamWorldYemen, Rep.ZambiaZimbabwe Timeline:
This timeline shows a graph from 1966 to 2014 of Hungary. No data until 1965. Number of actual observations by date: 49.
Source name:
World Development Indicators
Source organization:
IEA Statistics © OECD/IEA 2014 (http://www.iea.org/stats/index.asp), subject to https://www.iea.org/t&c/termsandconditions/
Categories, topics:
Environment
Last updated:
apr 23, 2017
Indicators value changes by year
At the date of observation
Value
Absolute change
Change from previous value
jan 1, 1966
9.505
+9.505
0.0%
jan 1, 1967
10.779
+1.274
13.4%
jan 1, 1968
11.577
+0.798
7.4%
jan 1, 1969
11.63
+0.053
0.46%
jan 1, 1970
12.121
+0.491
4.22%
jan 1, 1971
11.649
-0.471
-3.89%
jan 1, 1972
11.88
+0.231
1.98%
jan 1, 1973
10.786
-1.094
-9.21%
jan 1, 1974
10.583
-0.203
-1.88%
jan 1, 1975
10.992
+0.409
3.86%
jan 1, 1976
10.899
-0.093
-0.84%
jan 1, 1977
10.196
-0.703
-6.45%
jan 1, 1978
10.593
+0.396
3.89%
jan 1, 1979
10.468
-0.125
-1.18%
jan 1, 1980
10.36
-0.108
-1.03%
jan 1, 1981
10.251
-0.109
-1.05%
jan 1, 1982
9.984
-0.266
-2.6%
jan 1, 1983
9.71
-0.274
-2.74%
jan 1, 1984
9.572
-0.138
-1.42%
jan 1, 1985
9.503
-0.069
-0.72%
jan 1, 1986
9.703
+0.2
2.1%
jan 1, 1987
10.399
+0.696
7.17%
jan 1, 1988
10.704
+0.305
2.94%
jan 1, 1989
11.427
+0.724
6.76%
jan 1, 1990
12.111
+0.684
5.98%
jan 1, 1991
12.789
+0.678
5.6%
jan 1, 1992
11.582
-1.207
-9.44%
jan 1, 1993
12.439
+0.857
7.4%
jan 1, 1994
12.376
-0.063
-0.51%
jan 1, 1995
12.224
-0.152
-1.23%
jan 1, 1996
12.638
+0.414
3.38%
jan 1, 1997
12.398
-0.24
-1.9%
jan 1, 1998
13.487
+1.09
8.79%
jan 1, 1999
14.963
+1.475
10.94%
jan 1, 2000
15.75
+0.787
5.26%
jan 1, 2001
16.645
+0.895
5.68%
jan 1, 2002
17.003
+0.359
2.15%
jan 1, 2003
18.365
+1.361
8.01%
jan 1, 2004
18.316
-0.048
-0.26%
jan 1, 2005
19.757
+1.44
7.86%
jan 1, 2006
21.546
+1.789
9.06%
jan 1, 2007
23.264
+1.718
7.98%
jan 1, 2008
24.695
+1.431
6.15%
jan 1, 2009
24.889
+0.194
0.78%
jan 1, 2010
27.31
+2.421
9.73%
jan 1, 2011
24.521
-2.788
-10.21%
jan 1, 2012
24.678
+0.157
0.64%
jan 1, 2013
25.582
+0.904
3.66%
jan 1, 2014
25.139
-0.443
-1.73%
Ranking of countries by current statistics by years


Comments: