29
/
en
AIzaSyAYiBZKx7MnpbEhh9jyipgxe19OcubqV5w
April 1, 2024
52473
OECD members
OED
false
2
1
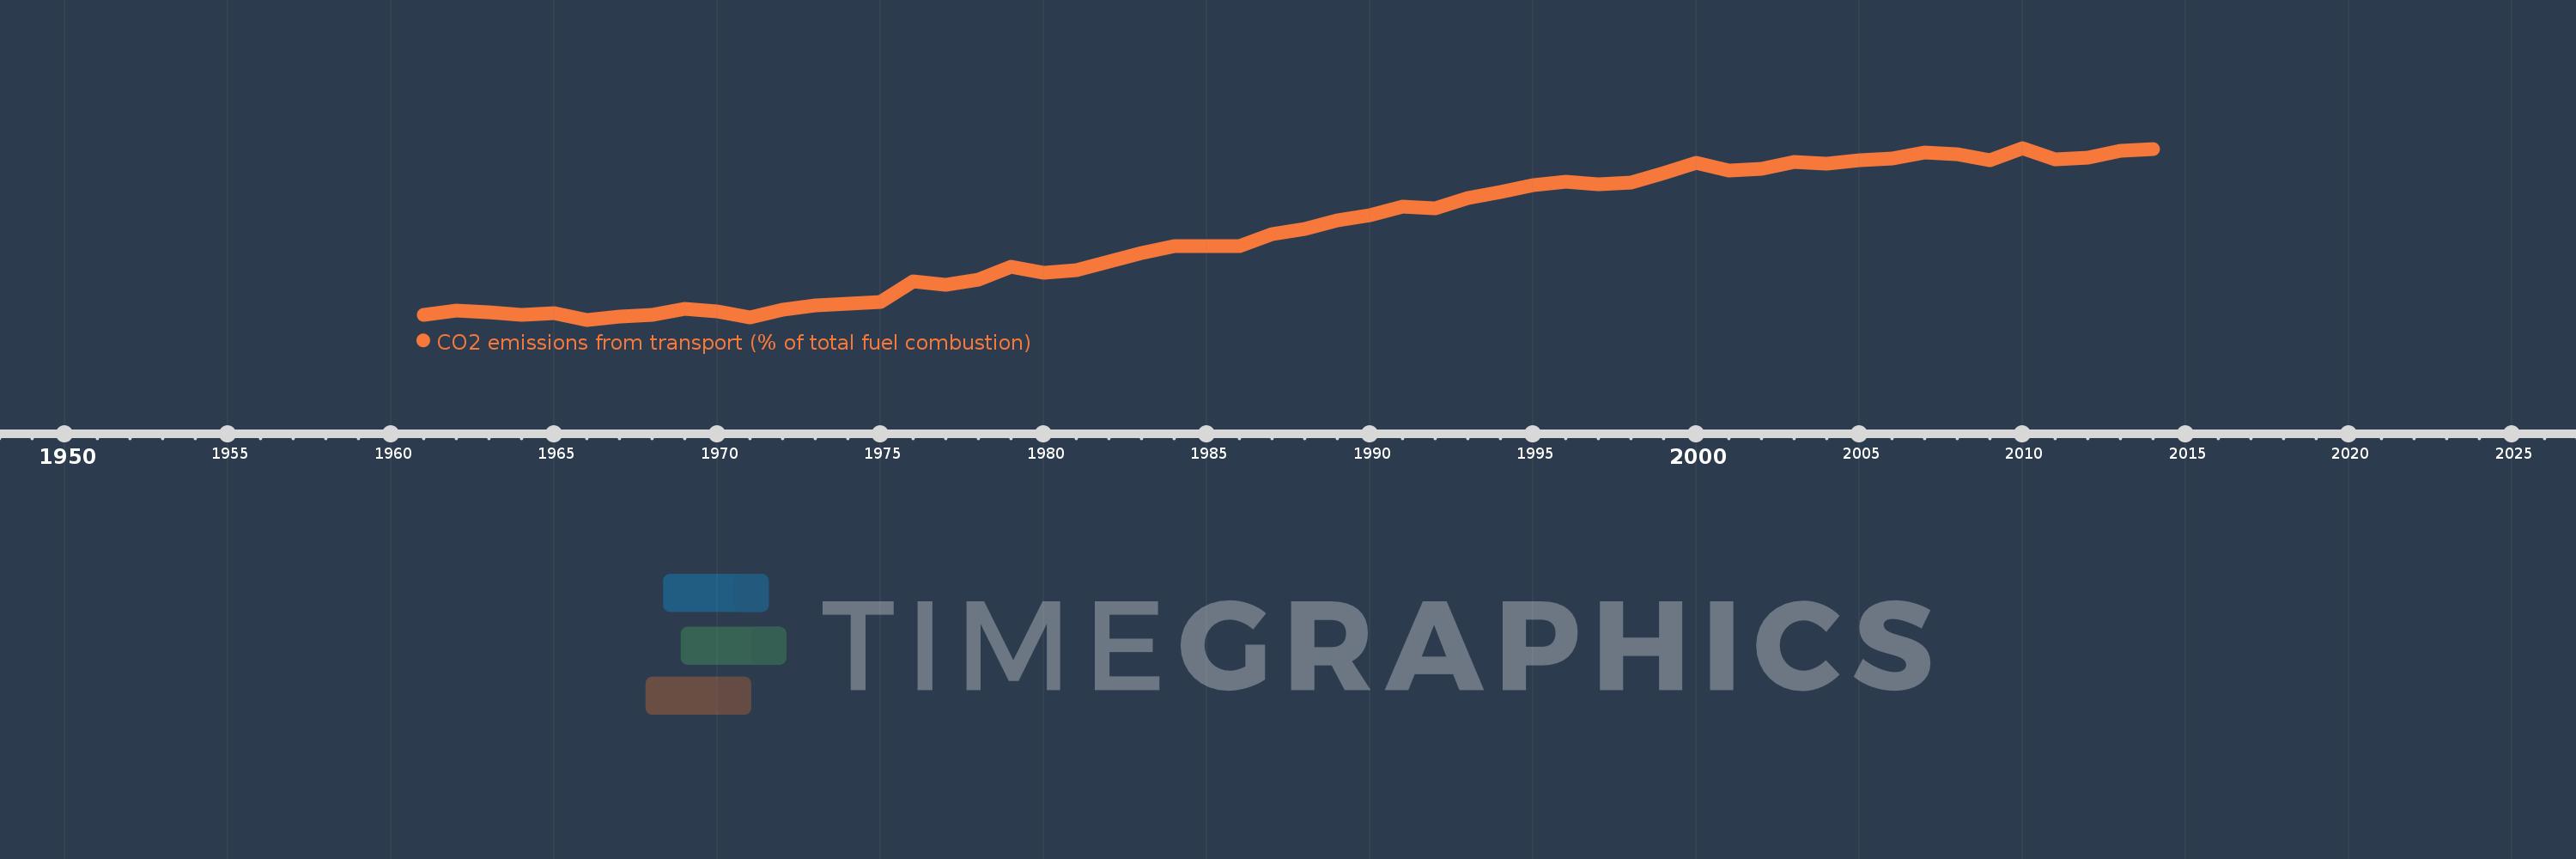
CO2 emissions from transport (% of total fuel combustion)
2014,2013,2012,2011,2010,2009,2008,2007,2006,2005,2004,2003,2002,2001,2000,1999,1998,1997,1996,1995,1994,1993,1992,1991,1990,1989,1988,1987,1986,1985,1984,1983,1982,1981,1980,1979,1978,1977,1976,1975,1974,1973,1972,1971,1970,1969,1968,1967,1966,1965,1964,1963,1962,1961
This statistics in other country:
AlbaniaAlgeriaAngolaArab WorldArgentinaArmeniaAustraliaAustriaAzerbaijanBahrainBangladeshBelarusBelgiumBeninBoliviaBosnia and HerzegovinaBotswanaBrazilBrunei DarussalamBulgariaCambodiaCameroonCanadaCaribbean small statesCentral Europe and the BalticsChileChinaColombiaCongo, Dem. Rep.Congo, Rep.Costa RicaCote d'IvoireCroatiaCubaCuracaoCyprusCzech RepublicDenmarkDominican RepublicEarly-demographic dividendEast Asia & PacificEast Asia & Pacific (excluding high income)East Asia & Pacific (IDA & IBRD countries)EcuadorEgypt, Arab Rep.El SalvadorEritreaEstoniaEthiopiaEuro areaEurope & Central AsiaEurope & Central Asia (excluding high income)Europe & Central Asia (IDA & IBRD countries)European UnionFinlandFragile and conflict affected situationsFranceGabonGeorgiaGermanyGhanaGibraltarGreeceGuatemalaHaitiHeavily indebted poor countries (HIPC)High incomeHondurasHong Kong SAR, ChinaHungaryIBRD onlyIcelandIDA & IBRD totalIDA blendIDA onlyIDA totalIndiaIndonesiaIran, Islamic Rep.IraqIrelandIsraelItalyJamaicaJapanJordanKazakhstanKenyaKorea, Dem. People’s Rep.Korea, Rep.KosovoKuwaitKyrgyz RepublicLate-demographic dividendLatin America & Caribbean Latin America & Caribbean (excluding high income)Latin America & the Caribbean (IDA & IBRD countries)LatviaLeast developed countries: UN classificationLebanonLibyaLithuaniaLow & middle incomeLow incomeLower middle incomeLuxembourgMacedonia, FYRMalaysiaMaltaMauritiusMexicoMiddle East & North AfricaMiddle East & North Africa (excluding high income)Middle East & North Africa (IDA & IBRD countries)Middle incomeMoldovaMongoliaMontenegroMoroccoMozambiqueMyanmarNamibiaNepalNetherlandsNew ZealandNicaraguaNigerNigeriaNorth AmericaNorwayOECD membersOmanOther small statesPakistanPanamaParaguayPeruPhilippinesPolandPortugalPost-demographic dividendPre-demographic dividendQatarRomaniaRussian FederationSaudi ArabiaSenegalSerbiaSingaporeSlovak RepublicSloveniaSmall statesSouth AfricaSouth AsiaSouth Asia (IDA & IBRD)South SudanSpainSri LankaSub-Saharan Africa Sub-Saharan Africa (excluding high income)Sub-Saharan Africa (IDA & IBRD countries)SudanSwedenSwitzerlandSyrian Arab RepublicTajikistanTanzaniaThailandTogoTrinidad and TobagoTunisiaTurkeyTurkmenistanUkraineUnited Arab EmiratesUnited KingdomUnited StatesUpper middle incomeUruguayUzbekistanVenezuela, RBVietnamWorldYemen, Rep.ZambiaZimbabwe Timeline:
This timeline shows a graph from 1961 to 2014 of OECD members. No data until 1960. Number of actual observations by date: 54.
Source name:
World Development Indicators
Source organization:
IEA Statistics © OECD/IEA 2014 (http://www.iea.org/stats/index.asp), subject to https://www.iea.org/t&c/termsandconditions/
Categories, topics:
Environment
Last updated:
apr 23, 2017
Indicators value changes by year
Minimum:
18.931
jan 1, 1966
Maximum:
28.169
jan 1, 2010
At the date of observation
Value
Absolute change
Change from previous value
jan 1, 1961
19.173
+19.173
0.0%
jan 1, 1962
19.414
+0.241
1.26%
jan 1, 1963
19.341
-0.073
-0.38%
jan 1, 1964
19.192
-0.149
-0.77%
jan 1, 1965
19.271
+0.079
0.41%
jan 1, 1966
18.931
-0.34
-1.77%
jan 1, 1967
19.084
+0.153
0.81%
jan 1, 1968
19.2
+0.116
0.61%
jan 1, 1969
19.514
+0.314
1.63%
jan 1, 1970
19.367
-0.147
-0.75%
jan 1, 1971
19.062
-0.305
-1.57%
jan 1, 1972
19.451
+0.389
2.04%
jan 1, 1973
19.719
+0.267
1.37%
jan 1, 1974
19.772
+0.053
0.27%
jan 1, 1975
19.897
+0.125
0.63%
jan 1, 1976
21.009
+1.112
5.59%
jan 1, 1977
20.795
-0.214
-1.02%
jan 1, 1978
21.072
+0.277
1.33%
jan 1, 1979
21.761
+0.689
3.27%
jan 1, 1980
21.44
-0.321
-1.48%
jan 1, 1981
21.619
+0.179
0.84%
jan 1, 1982
22.04
+0.421
1.95%
jan 1, 1983
22.517
+0.477
2.16%
jan 1, 1984
22.91
+0.393
1.75%
jan 1, 1985
22.883
-0.027
-0.12%
jan 1, 1986
22.905
+0.022
0.1%
jan 1, 1987
23.517
+0.612
2.67%
jan 1, 1988
23.824
+0.307
1.31%
jan 1, 1989
24.293
+0.469
1.97%
jan 1, 1990
24.545
+0.252
1.04%
jan 1, 1991
25.009
+0.464
1.89%
jan 1, 1992
24.929
-0.079
-0.32%
jan 1, 1993
25.489
+0.559
2.24%
jan 1, 1994
25.801
+0.312
1.22%
jan 1, 1995
26.169
+0.369
1.43%
jan 1, 1996
26.356
+0.186
0.71%
jan 1, 1997
26.236
-0.12
-0.45%
jan 1, 1998
26.303
+0.067
0.25%
jan 1, 1999
26.799
+0.496
1.89%
jan 1, 2000
27.362
+0.564
2.1%
jan 1, 2001
26.937
-0.425
-1.55%
jan 1, 2002
27.024
+0.087
0.32%
jan 1, 2003
27.408
+0.384
1.42%
jan 1, 2004
27.31
-0.098
-0.36%
jan 1, 2005
27.486
+0.176
0.65%
jan 1, 2006
27.6
+0.114
0.41%
jan 1, 2007
27.92
+0.32
1.16%
jan 1, 2008
27.809
-0.111
-0.4%
jan 1, 2009
27.53
-0.279
-1.0%
jan 1, 2010
28.169
+0.638
2.32%
jan 1, 2011
27.568
-0.601
-2.13%
jan 1, 2012
27.67
+0.103
0.37%
jan 1, 2013
28.028
+0.357
1.29%
jan 1, 2014
28.116
+0.088
0.31%
Ranking of countries by current statistics by years


Comments: