29
/
en
AIzaSyAYiBZKx7MnpbEhh9jyipgxe19OcubqV5w
April 1, 2024
155720
Indonesia
IDN
true
2
1
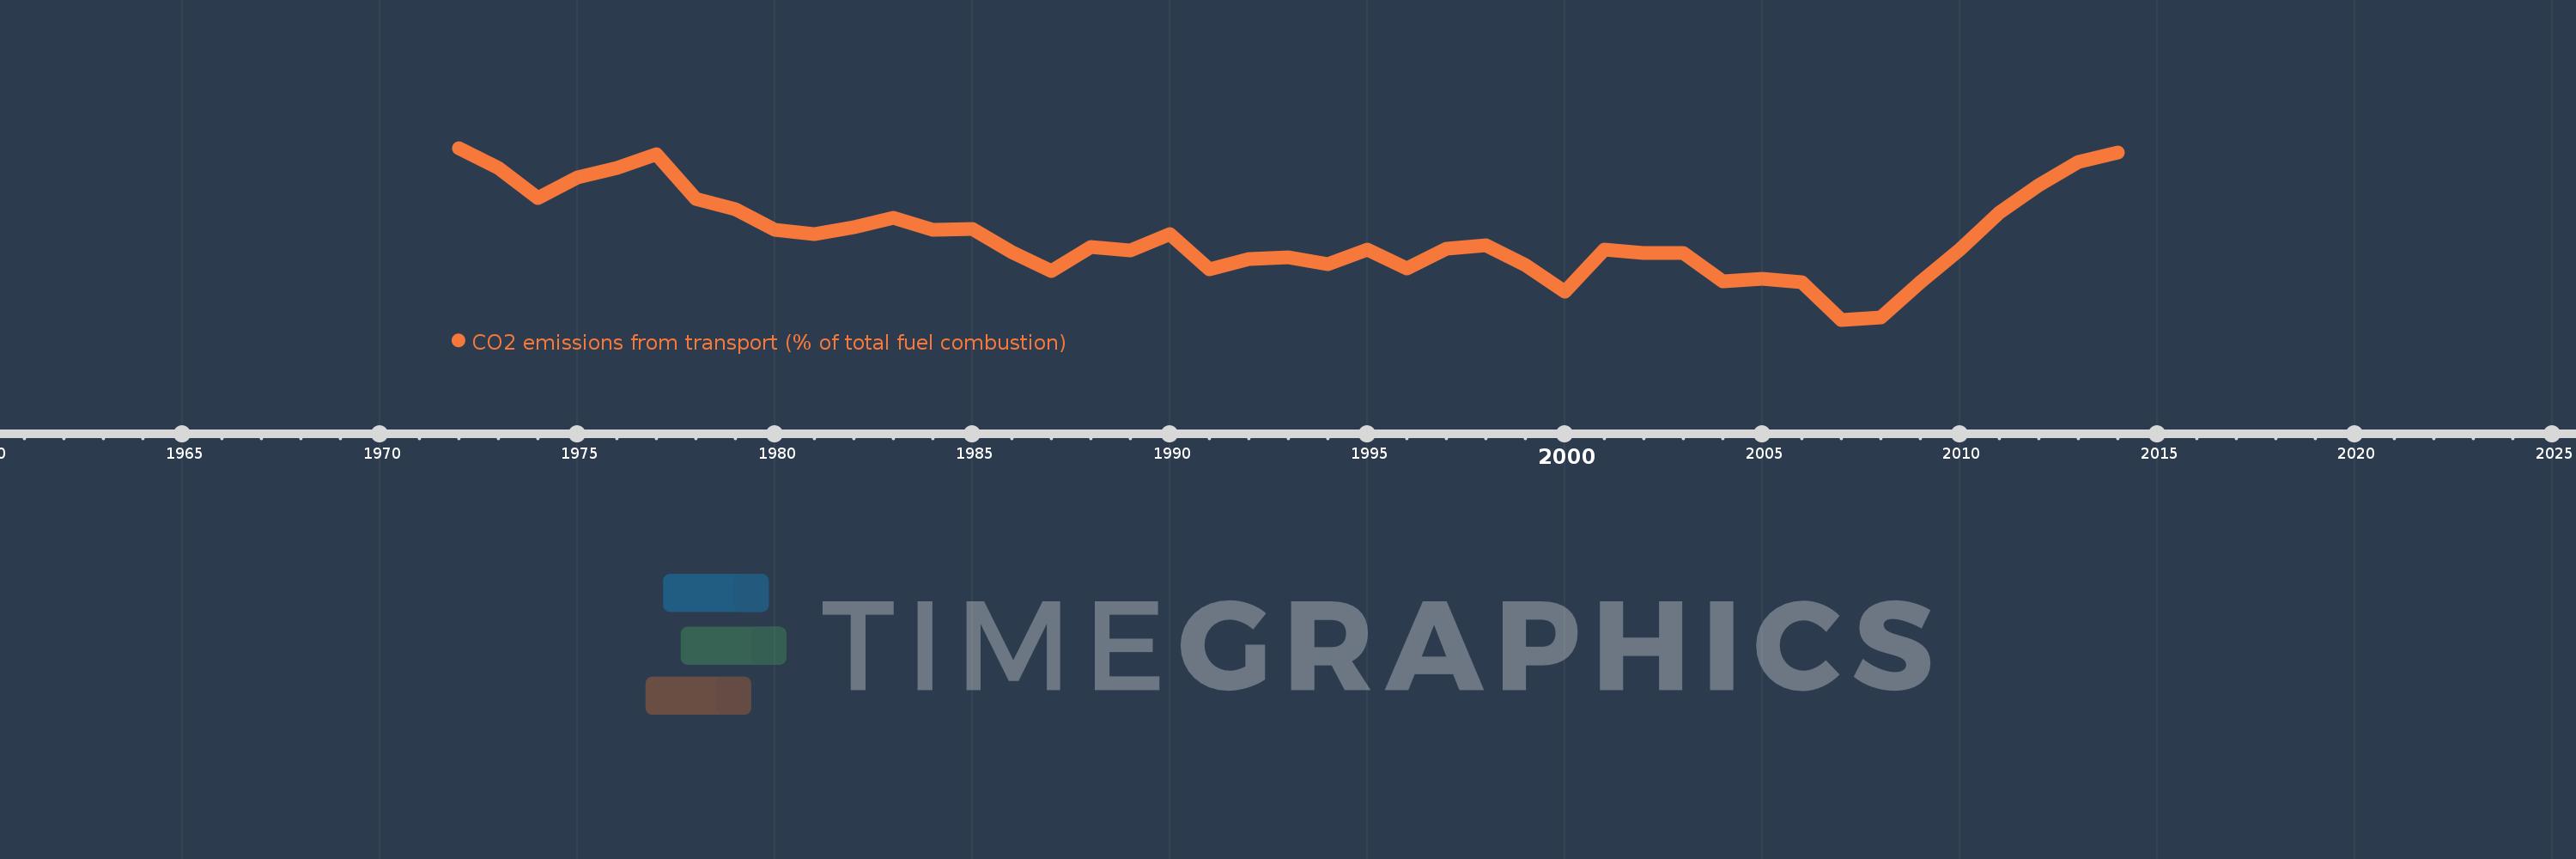
CO2 emissions from transport (% of total fuel combustion)
2014,2013,2012,2011,2010,2009,2008,2007,2006,2005,2004,2003,2002,2001,2000,1999,1998,1997,1996,1995,1994,1993,1992,1991,1990,1989,1988,1987,1986,1985,1984,1983,1982,1981,1980,1979,1978,1977,1976,1975,1974,1973,1972
This statistics in other country:
AlbaniaAlgeriaAngolaArab WorldArgentinaArmeniaAustraliaAustriaAzerbaijanBahrainBangladeshBelarusBelgiumBeninBoliviaBosnia and HerzegovinaBotswanaBrazilBrunei DarussalamBulgariaCambodiaCameroonCanadaCaribbean small statesCentral Europe and the BalticsChileChinaColombiaCongo, Dem. Rep.Congo, Rep.Costa RicaCote d'IvoireCroatiaCubaCuracaoCyprusCzech RepublicDenmarkDominican RepublicEarly-demographic dividendEast Asia & PacificEast Asia & Pacific (excluding high income)East Asia & Pacific (IDA & IBRD countries)EcuadorEgypt, Arab Rep.El SalvadorEritreaEstoniaEthiopiaEuro areaEurope & Central AsiaEurope & Central Asia (excluding high income)Europe & Central Asia (IDA & IBRD countries)European UnionFinlandFragile and conflict affected situationsFranceGabonGeorgiaGermanyGhanaGibraltarGreeceGuatemalaHaitiHeavily indebted poor countries (HIPC)High incomeHondurasHong Kong SAR, ChinaHungaryIBRD onlyIcelandIDA & IBRD totalIDA blendIDA onlyIDA totalIndiaIndonesiaIran, Islamic Rep.IraqIrelandIsraelItalyJamaicaJapanJordanKazakhstanKenyaKorea, Dem. People’s Rep.Korea, Rep.KosovoKuwaitKyrgyz RepublicLate-demographic dividendLatin America & Caribbean Latin America & Caribbean (excluding high income)Latin America & the Caribbean (IDA & IBRD countries)LatviaLeast developed countries: UN classificationLebanonLibyaLithuaniaLow & middle incomeLow incomeLower middle incomeLuxembourgMacedonia, FYRMalaysiaMaltaMauritiusMexicoMiddle East & North AfricaMiddle East & North Africa (excluding high income)Middle East & North Africa (IDA & IBRD countries)Middle incomeMoldovaMongoliaMontenegroMoroccoMozambiqueMyanmarNamibiaNepalNetherlandsNew ZealandNicaraguaNigerNigeriaNorth AmericaNorwayOECD membersOmanOther small statesPakistanPanamaParaguayPeruPhilippinesPolandPortugalPost-demographic dividendPre-demographic dividendQatarRomaniaRussian FederationSaudi ArabiaSenegalSerbiaSingaporeSlovak RepublicSloveniaSmall statesSouth AfricaSouth AsiaSouth Asia (IDA & IBRD)South SudanSpainSri LankaSub-Saharan Africa Sub-Saharan Africa (excluding high income)Sub-Saharan Africa (IDA & IBRD countries)SudanSwedenSwitzerlandSyrian Arab RepublicTajikistanTanzaniaThailandTogoTrinidad and TobagoTunisiaTurkeyTurkmenistanUkraineUnited Arab EmiratesUnited KingdomUnited StatesUpper middle incomeUruguayUzbekistanVenezuela, RBVietnamWorldYemen, Rep.ZambiaZimbabwe Timeline:
This timeline shows a graph from 1972 to 2014 of Indonesia. No data until 1971. Number of actual observations by date: 43.
Source name:
World Development Indicators
Source organization:
IEA Statistics © OECD/IEA 2014 (http://www.iea.org/stats/index.asp), subject to https://www.iea.org/t&c/termsandconditions/
Categories, topics:
Environment
Last updated:
apr 23, 2017
Indicators value changes by year
Maximum:
32.143
jan 1, 1972
At the date of observation
Value
Absolute change
Change from previous value
jan 1, 1972
32.143
+32.143
0.0%
jan 1, 1973
30.805
-1.338
-4.16%
jan 1, 1974
28.816
-1.988
-6.45%
jan 1, 1975
30.156
+1.34
4.65%
jan 1, 1976
30.796
+0.64
2.12%
jan 1, 1977
31.735
+0.939
3.05%
jan 1, 1978
28.732
-3.003
-9.46%
jan 1, 1979
28.046
-0.685
-2.38%
jan 1, 1980
26.685
-1.362
-4.86%
jan 1, 1981
26.409
-0.275
-1.03%
jan 1, 1982
26.875
+0.465
1.76%
jan 1, 1983
27.494
+0.619
2.3%
jan 1, 1984
26.676
-0.817
-2.97%
jan 1, 1985
26.729
+0.053
0.2%
jan 1, 1986
25.176
-1.553
-5.81%
jan 1, 1987
23.94
-1.236
-4.91%
jan 1, 1988
25.53
+1.59
6.64%
jan 1, 1989
25.33
-0.2
-0.78%
jan 1, 1990
26.377
+1.048
4.14%
jan 1, 1991
24.042
-2.335
-8.85%
jan 1, 1992
24.77
+0.728
3.03%
jan 1, 1993
24.841
+0.071
0.29%
jan 1, 1994
24.419
-0.422
-1.7%
jan 1, 1995
25.375
+0.956
3.91%
jan 1, 1996
24.126
-1.249
-4.92%
jan 1, 1997
25.44
+1.315
5.45%
jan 1, 1998
25.662
+0.222
0.87%
jan 1, 1999
24.362
-1.3
-5.07%
jan 1, 2000
22.547
-1.815
-7.45%
jan 1, 2001
25.402
+2.854
12.66%
jan 1, 2002
25.149
-0.252
-0.99%
jan 1, 2003
25.135
-0.014
-0.06%
jan 1, 2004
23.265
-1.87
-7.44%
jan 1, 2005
23.404
+0.139
0.6%
jan 1, 2006
23.221
-0.182
-0.78%
jan 1, 2007
20.7
-2.521
-10.86%
jan 1, 2008
20.88
+0.18
0.87%
jan 1, 2009
23.204
+2.324
11.13%
jan 1, 2010
25.36
+2.156
9.29%
jan 1, 2011
27.86
+2.5
9.86%
jan 1, 2012
29.693
+1.833
6.58%
jan 1, 2013
31.206
+1.513
5.09%
jan 1, 2014
31.85
+0.645
2.07%
Ranking of countries by current statistics by years


Comments: