29
/
en
AIzaSyAYiBZKx7MnpbEhh9jyipgxe19OcubqV5w
April 1, 2024
235495
Senegal
SEN
true
2
1
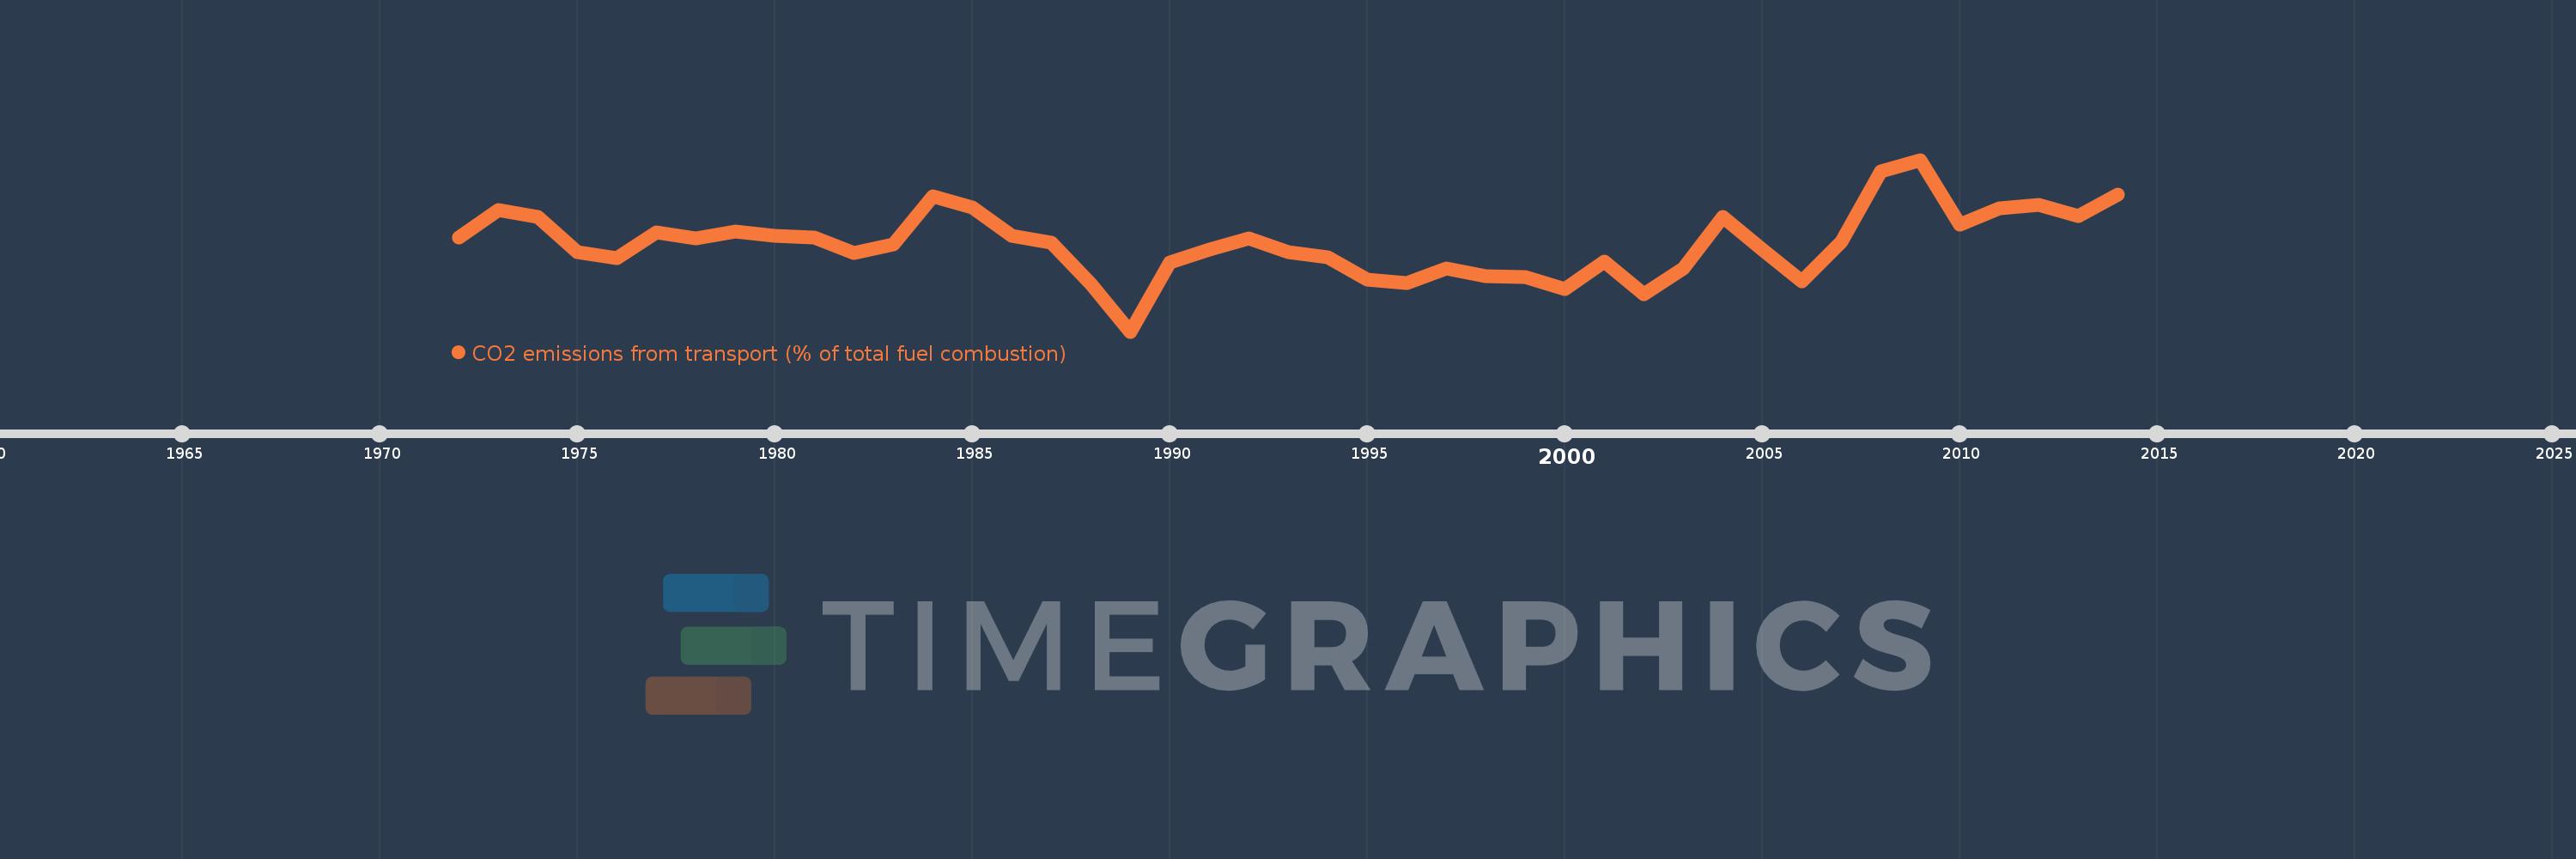
CO2 emissions from transport (% of total fuel combustion)
2014,2013,2012,2011,2010,2009,2008,2007,2006,2005,2004,2003,2002,2001,2000,1999,1998,1997,1996,1995,1994,1993,1992,1991,1990,1989,1988,1987,1986,1985,1984,1983,1982,1981,1980,1979,1978,1977,1976,1975,1974,1973,1972
This statistics in other country:
AlbaniaAlgeriaAngolaArab WorldArgentinaArmeniaAustraliaAustriaAzerbaijanBahrainBangladeshBelarusBelgiumBeninBoliviaBosnia and HerzegovinaBotswanaBrazilBrunei DarussalamBulgariaCambodiaCameroonCanadaCaribbean small statesCentral Europe and the BalticsChileChinaColombiaCongo, Dem. Rep.Congo, Rep.Costa RicaCote d'IvoireCroatiaCubaCuracaoCyprusCzech RepublicDenmarkDominican RepublicEarly-demographic dividendEast Asia & PacificEast Asia & Pacific (excluding high income)East Asia & Pacific (IDA & IBRD countries)EcuadorEgypt, Arab Rep.El SalvadorEritreaEstoniaEthiopiaEuro areaEurope & Central AsiaEurope & Central Asia (excluding high income)Europe & Central Asia (IDA & IBRD countries)European UnionFinlandFragile and conflict affected situationsFranceGabonGeorgiaGermanyGhanaGibraltarGreeceGuatemalaHaitiHeavily indebted poor countries (HIPC)High incomeHondurasHong Kong SAR, ChinaHungaryIBRD onlyIcelandIDA & IBRD totalIDA blendIDA onlyIDA totalIndiaIndonesiaIran, Islamic Rep.IraqIrelandIsraelItalyJamaicaJapanJordanKazakhstanKenyaKorea, Dem. People’s Rep.Korea, Rep.KosovoKuwaitKyrgyz RepublicLate-demographic dividendLatin America & Caribbean Latin America & Caribbean (excluding high income)Latin America & the Caribbean (IDA & IBRD countries)LatviaLeast developed countries: UN classificationLebanonLibyaLithuaniaLow & middle incomeLow incomeLower middle incomeLuxembourgMacedonia, FYRMalaysiaMaltaMauritiusMexicoMiddle East & North AfricaMiddle East & North Africa (excluding high income)Middle East & North Africa (IDA & IBRD countries)Middle incomeMoldovaMongoliaMontenegroMoroccoMozambiqueMyanmarNamibiaNepalNetherlandsNew ZealandNicaraguaNigerNigeriaNorth AmericaNorwayOECD membersOmanOther small statesPakistanPanamaParaguayPeruPhilippinesPolandPortugalPost-demographic dividendPre-demographic dividendQatarRomaniaRussian FederationSaudi ArabiaSenegalSerbiaSingaporeSlovak RepublicSloveniaSmall statesSouth AfricaSouth AsiaSouth Asia (IDA & IBRD)South SudanSpainSri LankaSub-Saharan Africa Sub-Saharan Africa (excluding high income)Sub-Saharan Africa (IDA & IBRD countries)SudanSwedenSwitzerlandSyrian Arab RepublicTajikistanTanzaniaThailandTogoTrinidad and TobagoTunisiaTurkeyTurkmenistanUkraineUnited Arab EmiratesUnited KingdomUnited StatesUpper middle incomeUruguayUzbekistanVenezuela, RBVietnamWorldYemen, Rep.ZambiaZimbabwe Timeline:
This timeline shows a graph from 1972 to 2014 of Senegal. No data until 1971. Number of actual observations by date: 43.
Source name:
World Development Indicators
Source organization:
IEA Statistics © OECD/IEA 2014 (http://www.iea.org/stats/index.asp), subject to https://www.iea.org/t&c/termsandconditions/
Categories, topics:
Environment
Last updated:
apr 23, 2017
Indicators value changes by year
Minimum:
27.411
jan 1, 1989
Maximum:
41.762
jan 1, 2009
At the date of observation
Value
Absolute change
Change from previous value
jan 1, 1972
35.246
+35.246
0.0%
jan 1, 1973
37.6
+2.354
6.68%
jan 1, 1974
36.957
-0.643
-1.71%
jan 1, 1975
34.014
-2.943
-7.96%
jan 1, 1976
33.54
-0.473
-1.39%
jan 1, 1977
35.714
+2.174
6.48%
jan 1, 1978
35.165
-0.549
-1.54%
jan 1, 1979
35.795
+0.631
1.79%
jan 1, 1980
35.385
-0.411
-1.15%
jan 1, 1981
35.294
-0.09
-0.26%
jan 1, 1982
34.0
-1.294
-3.67%
jan 1, 1983
34.715
+0.715
2.1%
jan 1, 1984
38.743
+4.028
11.6%
jan 1, 1985
37.745
-0.998
-2.58%
jan 1, 1986
35.377
-2.368
-6.27%
jan 1, 1987
34.804
-0.573
-1.62%
jan 1, 1988
31.401
-3.403
-9.78%
jan 1, 1989
27.411
-3.99
-12.71%
jan 1, 1990
33.173
+5.762
21.02%
jan 1, 1991
34.272
+1.099
3.31%
jan 1, 1992
35.211
+0.939
2.74%
jan 1, 1993
34.052
-1.16
-3.29%
jan 1, 1994
33.628
-0.423
-1.24%
jan 1, 1995
31.76
-1.869
-5.56%
jan 1, 1996
31.452
-0.308
-0.97%
jan 1, 1997
32.692
+1.241
3.94%
jan 1, 1998
32.056
-0.637
-1.95%
jan 1, 1999
31.975
-0.081
-0.25%
jan 1, 2000
30.986
-0.989
-3.09%
jan 1, 2001
33.239
+2.253
7.27%
jan 1, 2002
30.548
-2.69
-8.09%
jan 1, 2003
32.653
+2.105
6.89%
jan 1, 2004
37.008
+4.355
13.34%
jan 1, 2005
34.234
-2.774
-7.49%
jan 1, 2006
31.602
-2.633
-7.69%
jan 1, 2007
34.91
+3.308
10.47%
jan 1, 2008
40.763
+5.853
16.77%
jan 1, 2009
41.762
+0.999
2.45%
jan 1, 2010
36.313
-5.45
-13.05%
jan 1, 2011
37.729
+1.416
3.9%
jan 1, 2012
37.997
+0.268
0.71%
jan 1, 2013
37.037
-0.96
-2.53%
jan 1, 2014
38.833
+1.796
4.85%
Ranking of countries by current statistics by years


Comments: