29
/
en
AIzaSyAYiBZKx7MnpbEhh9jyipgxe19OcubqV5w
April 1, 2024
67537
Angola
AGO
true
2
1
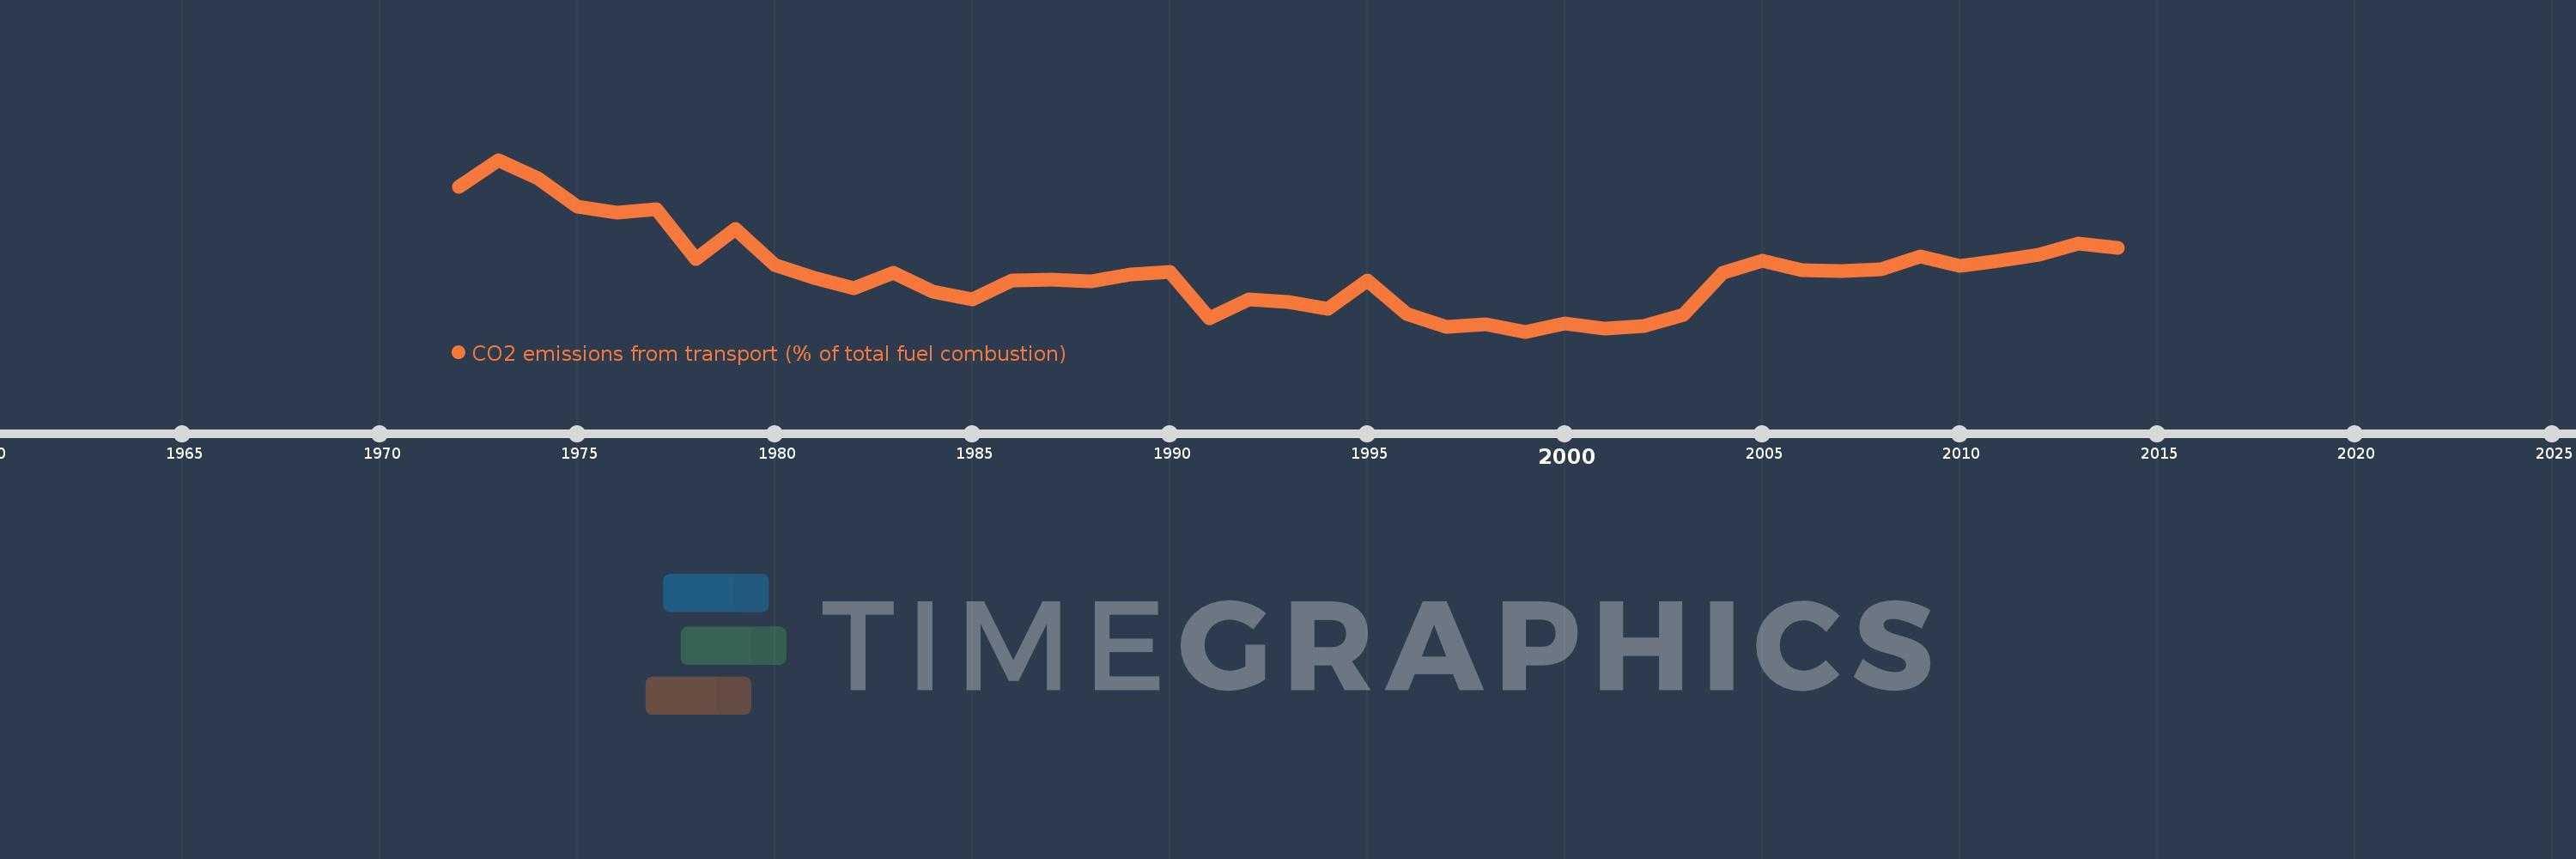
CO2 emissions from transport (% of total fuel combustion)
2014,2013,2012,2011,2010,2009,2008,2007,2006,2005,2004,2003,2002,2001,2000,1999,1998,1997,1996,1995,1994,1993,1992,1991,1990,1989,1988,1987,1986,1985,1984,1983,1982,1981,1980,1979,1978,1977,1976,1975,1974,1973,1972
This statistics in other country:
AlbaniaAlgeriaAngolaArab WorldArgentinaArmeniaAustraliaAustriaAzerbaijanBahrainBangladeshBelarusBelgiumBeninBoliviaBosnia and HerzegovinaBotswanaBrazilBrunei DarussalamBulgariaCambodiaCameroonCanadaCaribbean small statesCentral Europe and the BalticsChileChinaColombiaCongo, Dem. Rep.Congo, Rep.Costa RicaCote d'IvoireCroatiaCubaCuracaoCyprusCzech RepublicDenmarkDominican RepublicEarly-demographic dividendEast Asia & PacificEast Asia & Pacific (excluding high income)East Asia & Pacific (IDA & IBRD countries)EcuadorEgypt, Arab Rep.El SalvadorEritreaEstoniaEthiopiaEuro areaEurope & Central AsiaEurope & Central Asia (excluding high income)Europe & Central Asia (IDA & IBRD countries)European UnionFinlandFragile and conflict affected situationsFranceGabonGeorgiaGermanyGhanaGibraltarGreeceGuatemalaHaitiHeavily indebted poor countries (HIPC)High incomeHondurasHong Kong SAR, ChinaHungaryIBRD onlyIcelandIDA & IBRD totalIDA blendIDA onlyIDA totalIndiaIndonesiaIran, Islamic Rep.IraqIrelandIsraelItalyJamaicaJapanJordanKazakhstanKenyaKorea, Dem. People’s Rep.Korea, Rep.KosovoKuwaitKyrgyz RepublicLate-demographic dividendLatin America & Caribbean Latin America & Caribbean (excluding high income)Latin America & the Caribbean (IDA & IBRD countries)LatviaLeast developed countries: UN classificationLebanonLibyaLithuaniaLow & middle incomeLow incomeLower middle incomeLuxembourgMacedonia, FYRMalaysiaMaltaMauritiusMexicoMiddle East & North AfricaMiddle East & North Africa (excluding high income)Middle East & North Africa (IDA & IBRD countries)Middle incomeMoldovaMongoliaMontenegroMoroccoMozambiqueMyanmarNamibiaNepalNetherlandsNew ZealandNicaraguaNigerNigeriaNorth AmericaNorwayOECD membersOmanOther small statesPakistanPanamaParaguayPeruPhilippinesPolandPortugalPost-demographic dividendPre-demographic dividendQatarRomaniaRussian FederationSaudi ArabiaSenegalSerbiaSingaporeSlovak RepublicSloveniaSmall statesSouth AfricaSouth AsiaSouth Asia (IDA & IBRD)South SudanSpainSri LankaSub-Saharan Africa Sub-Saharan Africa (excluding high income)Sub-Saharan Africa (IDA & IBRD countries)SudanSwedenSwitzerlandSyrian Arab RepublicTajikistanTanzaniaThailandTogoTrinidad and TobagoTunisiaTurkeyTurkmenistanUkraineUnited Arab EmiratesUnited KingdomUnited StatesUpper middle incomeUruguayUzbekistanVenezuela, RBVietnamWorldYemen, Rep.ZambiaZimbabwe Timeline:
This timeline shows a graph from 1972 to 2014 of Angola. No data until 1971. Number of actual observations by date: 43.
Source name:
World Development Indicators
Source organization:
IEA Statistics © OECD/IEA 2014 (http://www.iea.org/stats/index.asp), subject to https://www.iea.org/t&c/termsandconditions/
Categories, topics:
Environment
Last updated:
apr 23, 2017
Indicators value changes by year
Minimum:
22.252
jan 1, 1999
At the date of observation
Value
Absolute change
Change from previous value
jan 1, 1972
63.58
+63.58
0.0%
jan 1, 1973
71.25
+7.67
12.06%
jan 1, 1974
65.909
-5.341
-7.5%
jan 1, 1975
57.778
-8.131
-12.34%
jan 1, 1976
56.122
-1.655
-2.86%
jan 1, 1977
57.216
+1.094
1.95%
jan 1, 1978
43.046
-14.17
-24.77%
jan 1, 1979
51.55
+8.504
19.76%
jan 1, 1980
41.339
-10.212
-19.81%
jan 1, 1981
37.594
-3.745
-9.06%
jan 1, 1982
34.524
-3.07
-8.17%
jan 1, 1983
39.091
+4.567
13.23%
jan 1, 1984
33.621
-5.47
-13.99%
jan 1, 1985
31.39
-2.231
-6.63%
jan 1, 1986
36.879
+5.489
17.49%
jan 1, 1987
37.184
+0.305
0.83%
jan 1, 1988
36.491
-0.693
-1.86%
jan 1, 1989
38.629
+2.138
5.86%
jan 1, 1990
39.394
+0.765
1.98%
jan 1, 1991
26.02
-13.374
-33.95%
jan 1, 1992
31.421
+5.401
20.76%
jan 1, 1993
30.591
-0.83
-2.64%
jan 1, 1994
28.673
-1.918
-6.27%
jan 1, 1995
36.842
+8.169
28.49%
jan 1, 1996
27.366
-9.476
-25.72%
jan 1, 1997
23.628
-3.738
-13.66%
jan 1, 1998
24.249
+0.622
2.63%
jan 1, 1999
22.252
-1.997
-8.24%
jan 1, 2000
24.473
+2.221
9.98%
jan 1, 2001
23.11
-1.362
-5.57%
jan 1, 2002
23.857
+0.747
3.23%
jan 1, 2003
26.909
+3.052
12.79%
jan 1, 2004
38.952
+12.043
44.75%
jan 1, 2005
42.432
+3.481
8.94%
jan 1, 2006
39.837
-2.595
-6.12%
jan 1, 2007
39.515
-0.322
-0.81%
jan 1, 2008
40.041
+0.526
1.33%
jan 1, 2009
43.692
+3.65
9.12%
jan 1, 2010
41.096
-2.596
-5.94%
jan 1, 2011
42.422
+1.326
3.23%
jan 1, 2012
44.092
+1.67
3.94%
jan 1, 2013
47.347
+3.255
7.38%
jan 1, 2014
46.133
-1.214
-2.56%
Ranking of countries by current statistics by years


Comments: