29
/
en
AIzaSyAYiBZKx7MnpbEhh9jyipgxe19OcubqV5w
April 1, 2024
28937
East Asia & Pacific (IDA & IBRD countries)
TEA
false
2
1
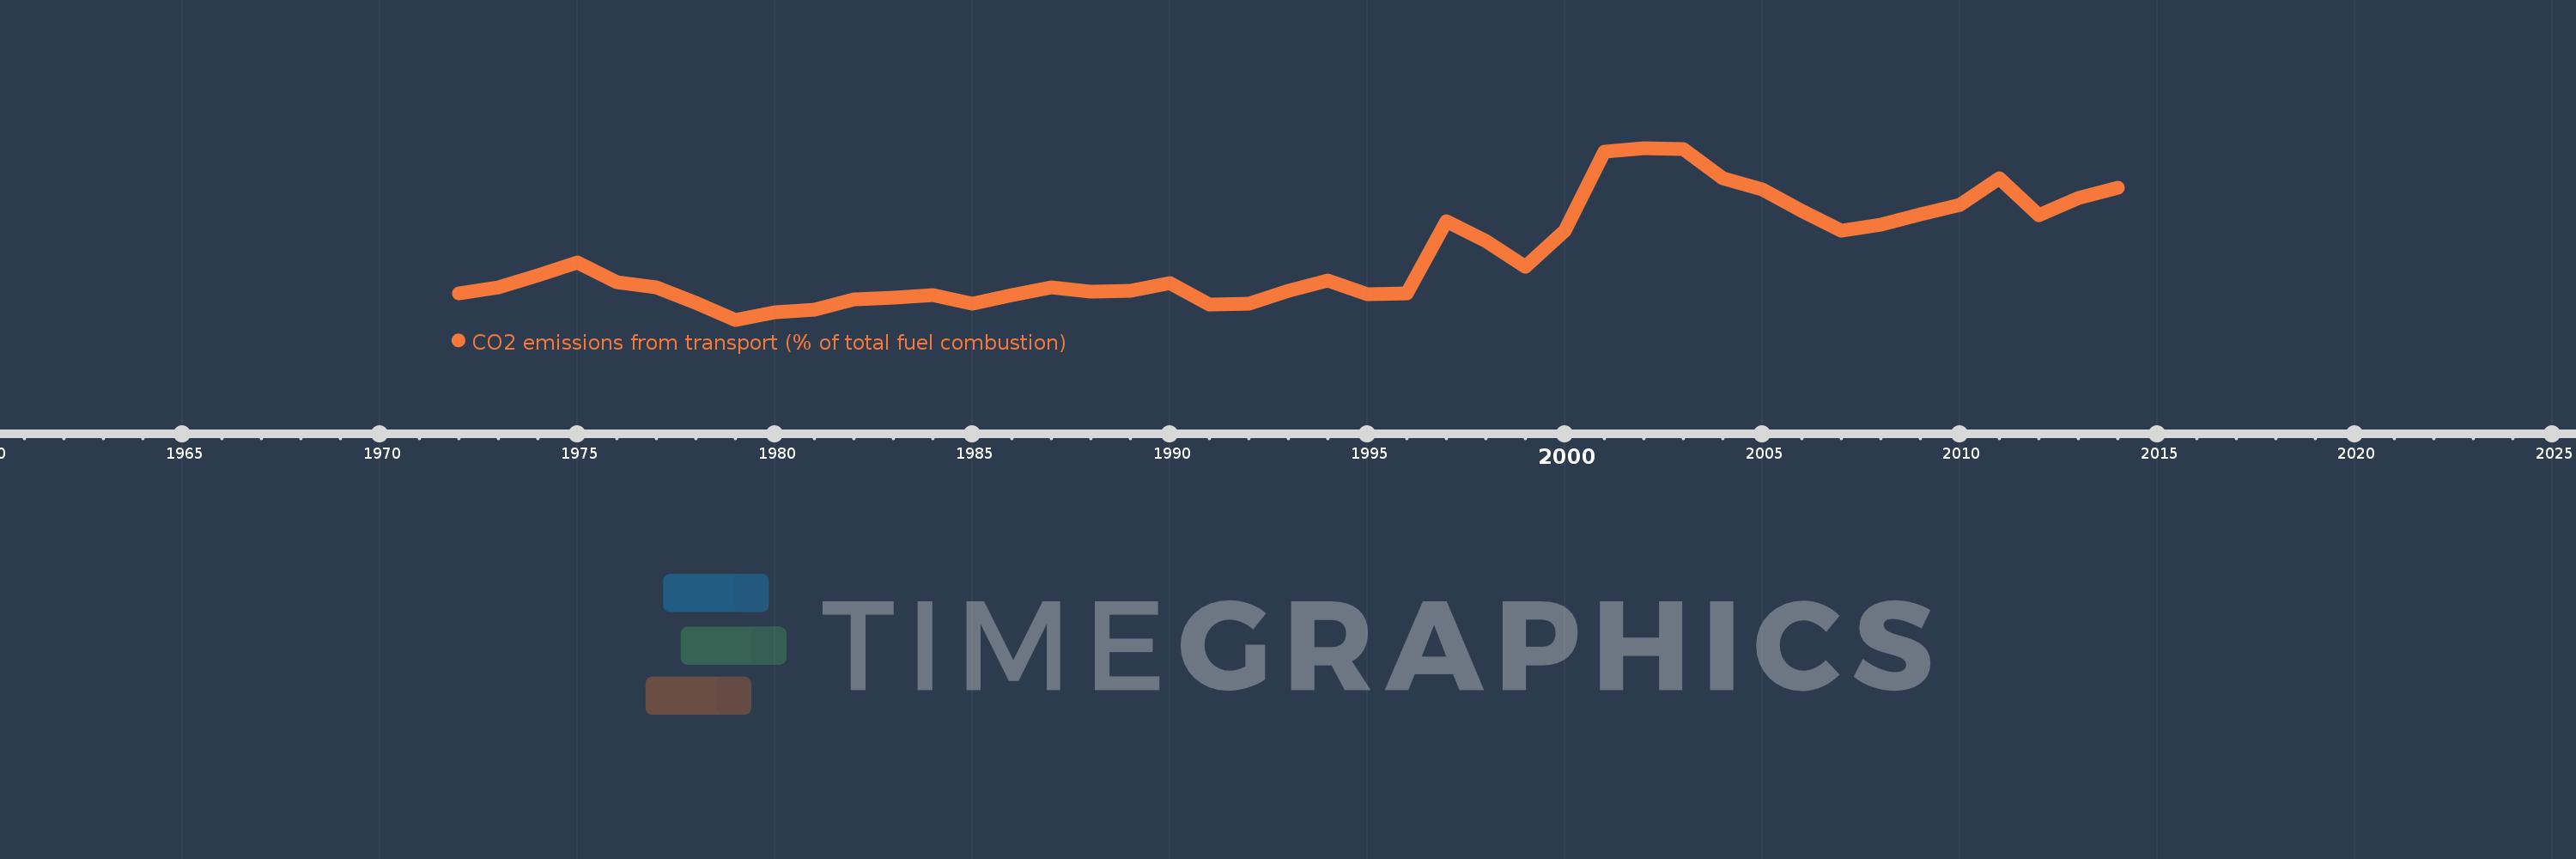
CO2 emissions from transport (% of total fuel combustion)
2014,2013,2012,2011,2010,2009,2008,2007,2006,2005,2004,2003,2002,2001,2000,1999,1998,1997,1996,1995,1994,1993,1992,1991,1990,1989,1988,1987,1986,1985,1984,1983,1982,1981,1980,1979,1978,1977,1976,1975,1974,1973,1972
This statistics in other country:
AlbaniaAlgeriaAngolaArab WorldArgentinaArmeniaAustraliaAustriaAzerbaijanBahrainBangladeshBelarusBelgiumBeninBoliviaBosnia and HerzegovinaBotswanaBrazilBrunei DarussalamBulgariaCambodiaCameroonCanadaCaribbean small statesCentral Europe and the BalticsChileChinaColombiaCongo, Dem. Rep.Congo, Rep.Costa RicaCote d'IvoireCroatiaCubaCuracaoCyprusCzech RepublicDenmarkDominican RepublicEarly-demographic dividendEast Asia & PacificEast Asia & Pacific (excluding high income)East Asia & Pacific (IDA & IBRD countries)EcuadorEgypt, Arab Rep.El SalvadorEritreaEstoniaEthiopiaEuro areaEurope & Central AsiaEurope & Central Asia (excluding high income)Europe & Central Asia (IDA & IBRD countries)European UnionFinlandFragile and conflict affected situationsFranceGabonGeorgiaGermanyGhanaGibraltarGreeceGuatemalaHaitiHeavily indebted poor countries (HIPC)High incomeHondurasHong Kong SAR, ChinaHungaryIBRD onlyIcelandIDA & IBRD totalIDA blendIDA onlyIDA totalIndiaIndonesiaIran, Islamic Rep.IraqIrelandIsraelItalyJamaicaJapanJordanKazakhstanKenyaKorea, Dem. People’s Rep.Korea, Rep.KosovoKuwaitKyrgyz RepublicLate-demographic dividendLatin America & Caribbean Latin America & Caribbean (excluding high income)Latin America & the Caribbean (IDA & IBRD countries)LatviaLeast developed countries: UN classificationLebanonLibyaLithuaniaLow & middle incomeLow incomeLower middle incomeLuxembourgMacedonia, FYRMalaysiaMaltaMauritiusMexicoMiddle East & North AfricaMiddle East & North Africa (excluding high income)Middle East & North Africa (IDA & IBRD countries)Middle incomeMoldovaMongoliaMontenegroMoroccoMozambiqueMyanmarNamibiaNepalNetherlandsNew ZealandNicaraguaNigerNigeriaNorth AmericaNorwayOECD membersOmanOther small statesPakistanPanamaParaguayPeruPhilippinesPolandPortugalPost-demographic dividendPre-demographic dividendQatarRomaniaRussian FederationSaudi ArabiaSenegalSerbiaSingaporeSlovak RepublicSloveniaSmall statesSouth AfricaSouth AsiaSouth Asia (IDA & IBRD)South SudanSpainSri LankaSub-Saharan Africa Sub-Saharan Africa (excluding high income)Sub-Saharan Africa (IDA & IBRD countries)SudanSwedenSwitzerlandSyrian Arab RepublicTajikistanTanzaniaThailandTogoTrinidad and TobagoTunisiaTurkeyTurkmenistanUkraineUnited Arab EmiratesUnited KingdomUnited StatesUpper middle incomeUruguayUzbekistanVenezuela, RBVietnamWorldYemen, Rep.ZambiaZimbabwe Timeline:
This timeline shows a graph from 1972 to 2014 of East Asia & Pacific (IDA & IBRD countries). No data until 1971. Number of actual observations by date: 43.
Source name:
World Development Indicators
Source organization:
IEA Statistics © OECD/IEA 2014 (http://www.iea.org/stats/index.asp), subject to https://www.iea.org/t&c/termsandconditions/
Categories, topics:
Environment
Last updated:
apr 23, 2017
Indicators value changes by year
At the date of observation
Value
Absolute change
Change from previous value
jan 1, 1972
8.247
+8.247
0.0%
jan 1, 1973
8.384
+0.137
1.66%
jan 1, 1974
8.653
+0.269
3.21%
jan 1, 1975
8.943
+0.29
3.35%
jan 1, 1976
8.507
-0.436
-4.87%
jan 1, 1977
8.383
-0.124
-1.46%
jan 1, 1978
8.045
-0.338
-4.03%
jan 1, 1979
7.663
-0.382
-4.75%
jan 1, 1980
7.838
+0.176
2.29%
jan 1, 1981
7.885
+0.047
0.6%
jan 1, 1982
8.117
+0.231
2.93%
jan 1, 1983
8.163
+0.046
0.57%
jan 1, 1984
8.206
+0.043
0.53%
jan 1, 1985
8.029
-0.177
-2.15%
jan 1, 1986
8.218
+0.189
2.35%
jan 1, 1987
8.39
+0.172
2.09%
jan 1, 1988
8.298
-0.092
-1.09%
jan 1, 1989
8.313
+0.015
0.18%
jan 1, 1990
8.491
+0.178
2.14%
jan 1, 1991
7.998
-0.493
-5.81%
jan 1, 1992
8.026
+0.028
0.35%
jan 1, 1993
8.31
+0.283
3.53%
jan 1, 1994
8.546
+0.237
2.85%
jan 1, 1995
8.232
-0.315
-3.68%
jan 1, 1996
8.249
+0.018
0.21%
jan 1, 1997
9.871
+1.622
19.66%
jan 1, 1998
9.422
-0.449
-4.55%
jan 1, 1999
8.858
-0.564
-5.99%
jan 1, 2000
9.662
+0.804
9.08%
jan 1, 2001
11.424
+1.762
18.24%
jan 1, 2002
11.51
+0.086
0.75%
jan 1, 2003
11.482
-0.027
-0.24%
jan 1, 2004
10.838
-0.644
-5.61%
jan 1, 2005
10.575
-0.263
-2.43%
jan 1, 2006
10.093
-0.482
-4.56%
jan 1, 2007
9.665
-0.428
-4.24%
jan 1, 2008
9.788
+0.123
1.27%
jan 1, 2009
10.025
+0.237
2.42%
jan 1, 2010
10.233
+0.207
2.07%
jan 1, 2011
10.834
+0.601
5.87%
jan 1, 2012
10.009
-0.824
-7.61%
jan 1, 2013
10.381
+0.371
3.71%
jan 1, 2014
10.623
+0.242
2.33%
Ranking of countries by current statistics by years


Comments: