29
/
en
AIzaSyAYiBZKx7MnpbEhh9jyipgxe19OcubqV5w
April 1, 2024
140121
Ghana
GHA
true
2
1
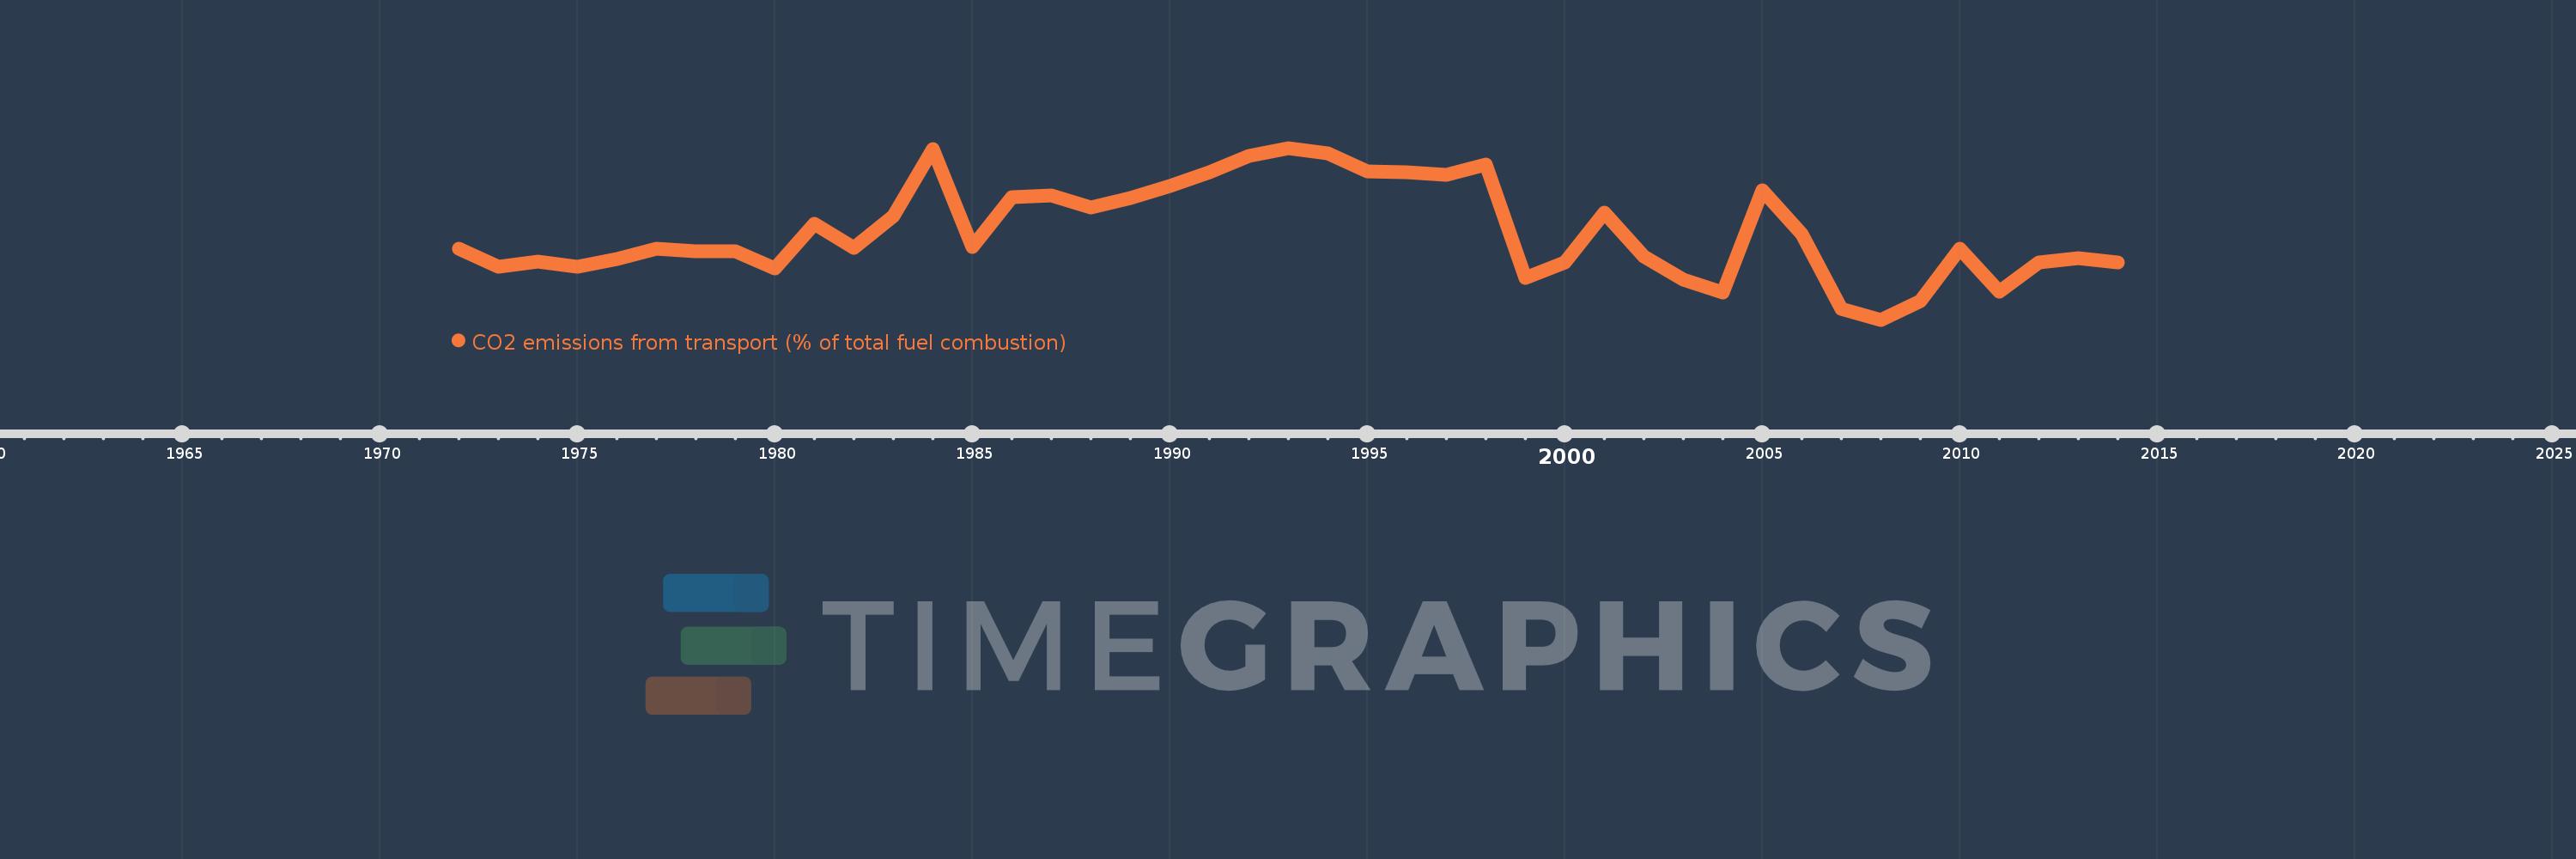
CO2 emissions from transport (% of total fuel combustion)
2014,2013,2012,2011,2010,2009,2008,2007,2006,2005,2004,2003,2002,2001,2000,1999,1998,1997,1996,1995,1994,1993,1992,1991,1990,1989,1988,1987,1986,1985,1984,1983,1982,1981,1980,1979,1978,1977,1976,1975,1974,1973,1972
This statistics in other country:
AlbaniaAlgeriaAngolaArab WorldArgentinaArmeniaAustraliaAustriaAzerbaijanBahrainBangladeshBelarusBelgiumBeninBoliviaBosnia and HerzegovinaBotswanaBrazilBrunei DarussalamBulgariaCambodiaCameroonCanadaCaribbean small statesCentral Europe and the BalticsChileChinaColombiaCongo, Dem. Rep.Congo, Rep.Costa RicaCote d'IvoireCroatiaCubaCuracaoCyprusCzech RepublicDenmarkDominican RepublicEarly-demographic dividendEast Asia & PacificEast Asia & Pacific (excluding high income)East Asia & Pacific (IDA & IBRD countries)EcuadorEgypt, Arab Rep.El SalvadorEritreaEstoniaEthiopiaEuro areaEurope & Central AsiaEurope & Central Asia (excluding high income)Europe & Central Asia (IDA & IBRD countries)European UnionFinlandFragile and conflict affected situationsFranceGabonGeorgiaGermanyGhanaGibraltarGreeceGuatemalaHaitiHeavily indebted poor countries (HIPC)High incomeHondurasHong Kong SAR, ChinaHungaryIBRD onlyIcelandIDA & IBRD totalIDA blendIDA onlyIDA totalIndiaIndonesiaIran, Islamic Rep.IraqIrelandIsraelItalyJamaicaJapanJordanKazakhstanKenyaKorea, Dem. People’s Rep.Korea, Rep.KosovoKuwaitKyrgyz RepublicLate-demographic dividendLatin America & Caribbean Latin America & Caribbean (excluding high income)Latin America & the Caribbean (IDA & IBRD countries)LatviaLeast developed countries: UN classificationLebanonLibyaLithuaniaLow & middle incomeLow incomeLower middle incomeLuxembourgMacedonia, FYRMalaysiaMaltaMauritiusMexicoMiddle East & North AfricaMiddle East & North Africa (excluding high income)Middle East & North Africa (IDA & IBRD countries)Middle incomeMoldovaMongoliaMontenegroMoroccoMozambiqueMyanmarNamibiaNepalNetherlandsNew ZealandNicaraguaNigerNigeriaNorth AmericaNorwayOECD membersOmanOther small statesPakistanPanamaParaguayPeruPhilippinesPolandPortugalPost-demographic dividendPre-demographic dividendQatarRomaniaRussian FederationSaudi ArabiaSenegalSerbiaSingaporeSlovak RepublicSloveniaSmall statesSouth AfricaSouth AsiaSouth Asia (IDA & IBRD)South SudanSpainSri LankaSub-Saharan Africa Sub-Saharan Africa (excluding high income)Sub-Saharan Africa (IDA & IBRD countries)SudanSwedenSwitzerlandSyrian Arab RepublicTajikistanTanzaniaThailandTogoTrinidad and TobagoTunisiaTurkeyTurkmenistanUkraineUnited Arab EmiratesUnited KingdomUnited StatesUpper middle incomeUruguayUzbekistanVenezuela, RBVietnamWorldYemen, Rep.ZambiaZimbabwe Timeline:
This timeline shows a graph from 1972 to 2014 of Ghana. No data until 1971. Number of actual observations by date: 43.
Source name:
World Development Indicators
Source organization:
IEA Statistics © OECD/IEA 2014 (http://www.iea.org/stats/index.asp), subject to https://www.iea.org/t&c/termsandconditions/
Categories, topics:
Environment
Last updated:
apr 23, 2017
Indicators value changes by year
Minimum:
45.769
jan 1, 2008
Maximum:
66.791
jan 1, 1993
At the date of observation
Value
Absolute change
Change from previous value
jan 1, 1972
54.45
+54.45
0.0%
jan 1, 1973
52.239
-2.211
-4.06%
jan 1, 1974
52.885
+0.646
1.24%
jan 1, 1975
52.294
-0.591
-1.12%
jan 1, 1976
53.247
+0.953
1.82%
jan 1, 1977
54.468
+1.221
2.29%
jan 1, 1978
54.183
-0.285
-0.52%
jan 1, 1979
54.15
-0.033
-0.06%
jan 1, 1980
52.036
-2.114
-3.9%
jan 1, 1981
57.534
+5.498
10.57%
jan 1, 1982
54.613
-2.922
-5.08%
jan 1, 1983
58.442
+3.829
7.01%
jan 1, 1984
66.667
+8.225
14.07%
jan 1, 1985
54.696
-11.971
-17.96%
jan 1, 1986
60.766
+6.069
11.1%
jan 1, 1987
60.987
+0.221
0.36%
jan 1, 1988
59.483
-1.504
-2.47%
jan 1, 1989
60.669
+1.187
2.0%
jan 1, 1990
62.121
+1.452
2.39%
jan 1, 1991
63.78
+1.658
2.67%
jan 1, 1992
65.789
+2.01
3.15%
jan 1, 1993
66.791
+1.002
1.52%
jan 1, 1994
66.176
-0.615
-0.92%
jan 1, 1995
63.946
-2.231
-3.37%
jan 1, 1996
63.863
-0.083
-0.13%
jan 1, 1997
63.533
-0.33
-0.52%
jan 1, 1998
64.722
+1.189
1.87%
jan 1, 1999
50.916
-13.806
-21.33%
jan 1, 2000
52.73
+1.815
3.56%
jan 1, 2001
58.835
+6.105
11.58%
jan 1, 2002
53.467
-5.368
-9.12%
jan 1, 2003
50.673
-2.795
-5.23%
jan 1, 2004
49.142
-1.531
-3.02%
jan 1, 2005
61.655
+12.513
25.46%
jan 1, 2006
56.25
-5.405
-8.77%
jan 1, 2007
47.097
-9.153
-16.27%
jan 1, 2008
45.769
-1.328
-2.82%
jan 1, 2009
48.067
+2.298
5.02%
jan 1, 2010
54.486
+6.419
13.36%
jan 1, 2011
49.187
-5.3
-9.73%
jan 1, 2012
52.773
+3.586
7.29%
jan 1, 2013
53.328
+0.555
1.05%
jan 1, 2014
52.821
-0.508
-0.95%
Ranking of countries by current statistics by years


Comments: