29
/
en
AIzaSyAYiBZKx7MnpbEhh9jyipgxe19OcubqV5w
April 1, 2024
181911
Luxembourg
LUX
true
2
1
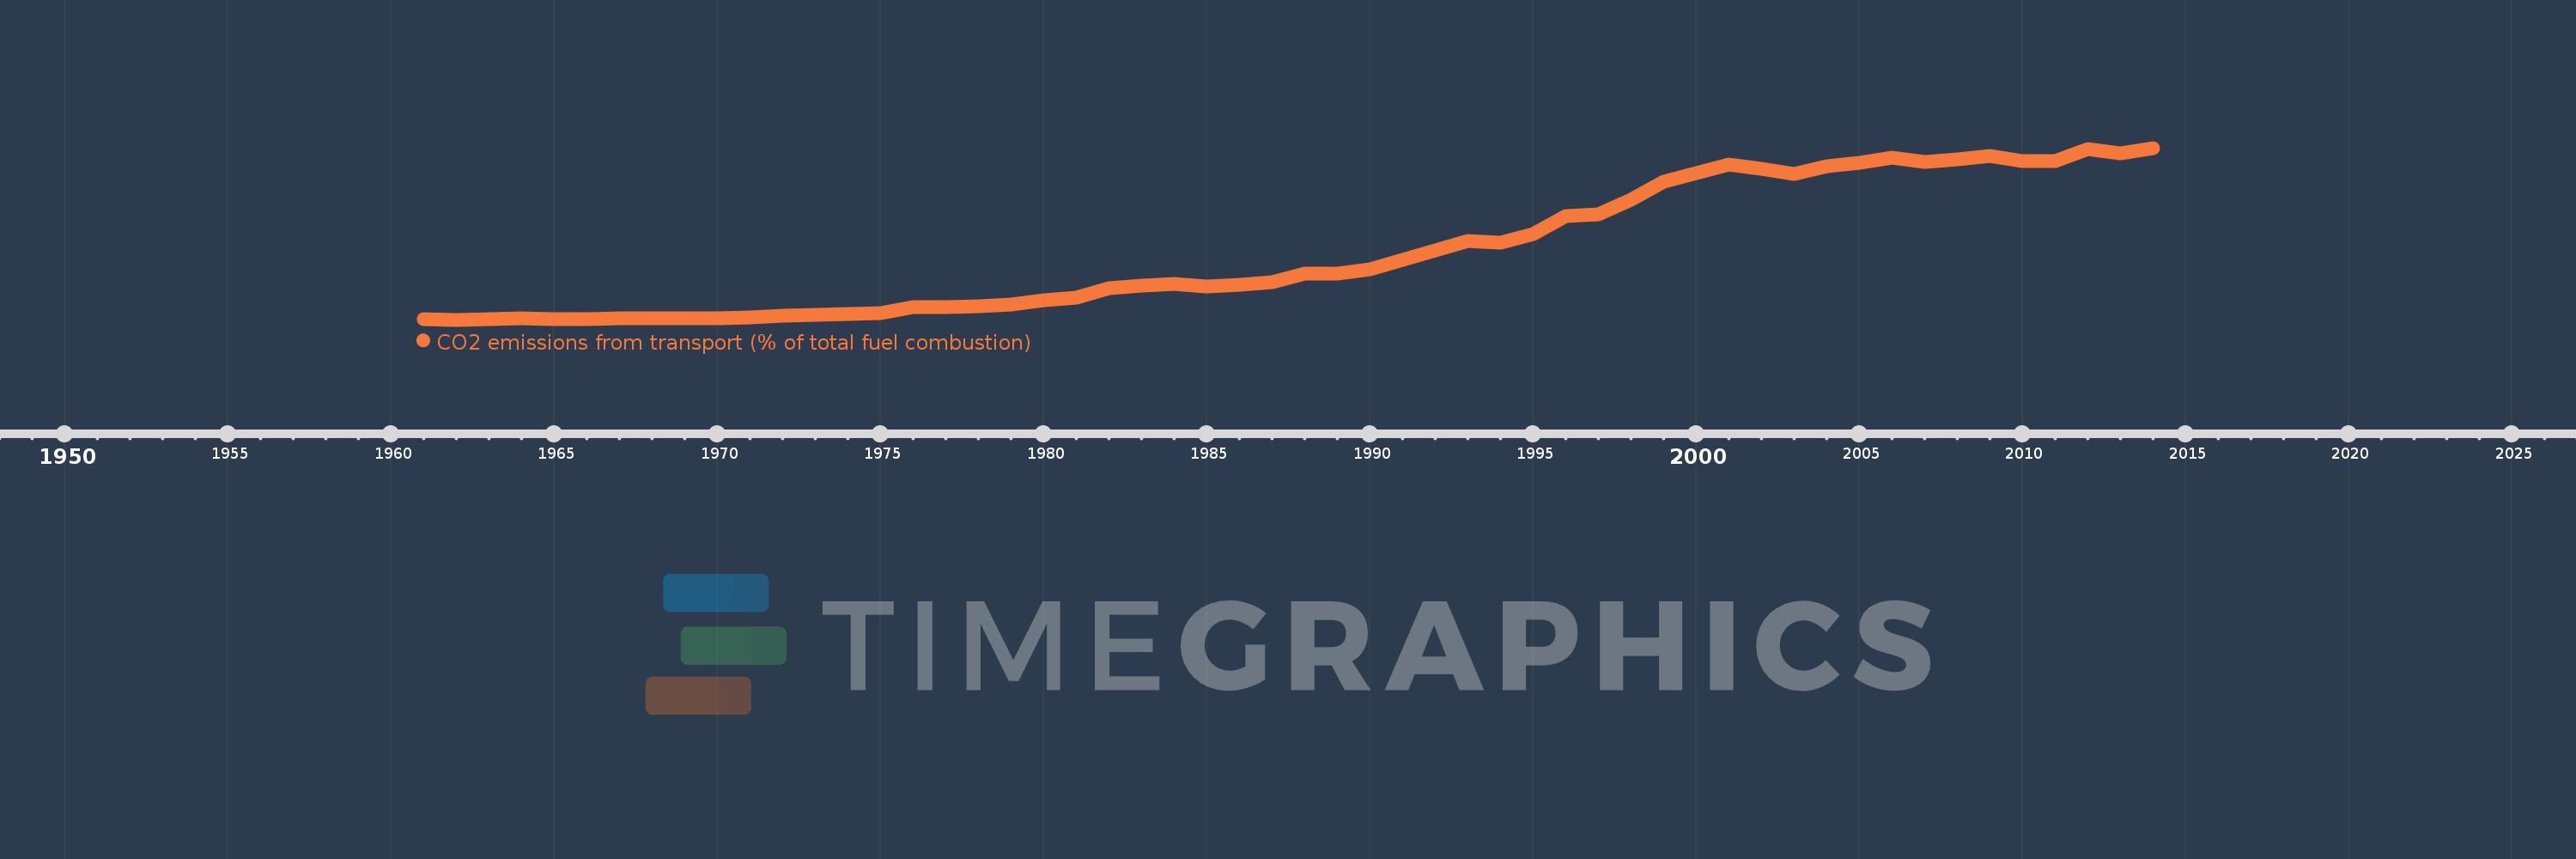
CO2 emissions from transport (% of total fuel combustion)
2014,2013,2012,2011,2010,2009,2008,2007,2006,2005,2004,2003,2002,2001,2000,1999,1998,1997,1996,1995,1994,1993,1992,1991,1990,1989,1988,1987,1986,1985,1984,1983,1982,1981,1980,1979,1978,1977,1976,1975,1974,1973,1972,1971,1970,1969,1968,1967,1966,1965,1964,1963,1962,1961
This statistics in other country:
AlbaniaAlgeriaAngolaArab WorldArgentinaArmeniaAustraliaAustriaAzerbaijanBahrainBangladeshBelarusBelgiumBeninBoliviaBosnia and HerzegovinaBotswanaBrazilBrunei DarussalamBulgariaCambodiaCameroonCanadaCaribbean small statesCentral Europe and the BalticsChileChinaColombiaCongo, Dem. Rep.Congo, Rep.Costa RicaCote d'IvoireCroatiaCubaCuracaoCyprusCzech RepublicDenmarkDominican RepublicEarly-demographic dividendEast Asia & PacificEast Asia & Pacific (excluding high income)East Asia & Pacific (IDA & IBRD countries)EcuadorEgypt, Arab Rep.El SalvadorEritreaEstoniaEthiopiaEuro areaEurope & Central AsiaEurope & Central Asia (excluding high income)Europe & Central Asia (IDA & IBRD countries)European UnionFinlandFragile and conflict affected situationsFranceGabonGeorgiaGermanyGhanaGibraltarGreeceGuatemalaHaitiHeavily indebted poor countries (HIPC)High incomeHondurasHong Kong SAR, ChinaHungaryIBRD onlyIcelandIDA & IBRD totalIDA blendIDA onlyIDA totalIndiaIndonesiaIran, Islamic Rep.IraqIrelandIsraelItalyJamaicaJapanJordanKazakhstanKenyaKorea, Dem. People’s Rep.Korea, Rep.KosovoKuwaitKyrgyz RepublicLate-demographic dividendLatin America & Caribbean Latin America & Caribbean (excluding high income)Latin America & the Caribbean (IDA & IBRD countries)LatviaLeast developed countries: UN classificationLebanonLibyaLithuaniaLow & middle incomeLow incomeLower middle incomeLuxembourgMacedonia, FYRMalaysiaMaltaMauritiusMexicoMiddle East & North AfricaMiddle East & North Africa (excluding high income)Middle East & North Africa (IDA & IBRD countries)Middle incomeMoldovaMongoliaMontenegroMoroccoMozambiqueMyanmarNamibiaNepalNetherlandsNew ZealandNicaraguaNigerNigeriaNorth AmericaNorwayOECD membersOmanOther small statesPakistanPanamaParaguayPeruPhilippinesPolandPortugalPost-demographic dividendPre-demographic dividendQatarRomaniaRussian FederationSaudi ArabiaSenegalSerbiaSingaporeSlovak RepublicSloveniaSmall statesSouth AfricaSouth AsiaSouth Asia (IDA & IBRD)South SudanSpainSri LankaSub-Saharan Africa Sub-Saharan Africa (excluding high income)Sub-Saharan Africa (IDA & IBRD countries)SudanSwedenSwitzerlandSyrian Arab RepublicTajikistanTanzaniaThailandTogoTrinidad and TobagoTunisiaTurkeyTurkmenistanUkraineUnited Arab EmiratesUnited KingdomUnited StatesUpper middle incomeUruguayUzbekistanVenezuela, RBVietnamWorldYemen, Rep.ZambiaZimbabwe Timeline:
This timeline shows a graph from 1961 to 2014 of Luxembourg. No data until 1960. Number of actual observations by date: 54.
Source name:
World Development Indicators
Source organization:
IEA Statistics © OECD/IEA 2014 (http://www.iea.org/stats/index.asp), subject to https://www.iea.org/t&c/termsandconditions/
Categories, topics:
Environment
Last updated:
apr 23, 2017
Indicators value changes by year
Maximum:
66.325
jan 1, 2014
At the date of observation
Value
Absolute change
Change from previous value
jan 1, 1961
2.242
+2.242
0.0%
jan 1, 1962
1.901
-0.342
-15.24%
jan 1, 1963
2.07
+0.169
8.89%
jan 1, 1964
2.52
+0.45
21.75%
jan 1, 1965
2.208
-0.312
-12.38%
jan 1, 1966
2.233
+0.025
1.12%
jan 1, 1967
2.466
+0.233
10.42%
jan 1, 1968
2.467
+0.001
0.06%
jan 1, 1969
2.529
+0.062
2.51%
jan 1, 1970
2.46
-0.069
-2.71%
jan 1, 1971
2.771
+0.311
12.65%
jan 1, 1972
3.283
+0.511
18.44%
jan 1, 1973
3.727
+0.444
13.53%
jan 1, 1974
3.901
+0.175
4.69%
jan 1, 1975
4.253
+0.351
9.01%
jan 1, 1976
6.677
+2.424
57.01%
jan 1, 1977
6.53
-0.147
-2.21%
jan 1, 1978
7.11
+0.58
8.88%
jan 1, 1979
7.491
+0.381
5.36%
jan 1, 1980
9.132
+1.641
21.9%
jan 1, 1981
10.209
+1.077
11.79%
jan 1, 1982
13.58
+3.371
33.02%
jan 1, 1983
14.59
+1.009
7.43%
jan 1, 1984
15.276
+0.687
4.71%
jan 1, 1985
14.257
-1.019
-6.67%
jan 1, 1986
15.005
+0.747
5.24%
jan 1, 1987
16.084
+1.079
7.19%
jan 1, 1988
19.108
+3.024
18.8%
jan 1, 1989
19.149
+0.041
0.21%
jan 1, 1990
20.79
+1.641
8.57%
jan 1, 1991
24.395
+3.605
17.34%
jan 1, 1992
28.05
+3.655
14.98%
jan 1, 1993
31.531
+3.481
12.41%
jan 1, 1994
30.955
-0.576
-1.83%
jan 1, 1995
34.109
+3.154
10.19%
jan 1, 1996
40.754
+6.646
19.48%
jan 1, 1997
41.446
+0.692
1.7%
jan 1, 1998
46.795
+5.349
12.91%
jan 1, 1999
53.652
+6.857
14.65%
jan 1, 2000
57.047
+3.395
6.33%
jan 1, 2001
60.174
+3.127
5.48%
jan 1, 2002
58.573
-1.601
-2.66%
jan 1, 2003
56.624
-1.949
-3.33%
jan 1, 2004
59.451
+2.827
4.99%
jan 1, 2005
60.819
+1.368
2.3%
jan 1, 2006
62.718
+1.899
3.12%
jan 1, 2007
61.027
-1.69
-2.7%
jan 1, 2008
61.927
+0.9
1.47%
jan 1, 2009
63.183
+1.256
2.03%
jan 1, 2010
61.37
-1.812
-2.87%
jan 1, 2011
61.408
+0.038
0.06%
jan 1, 2012
66.032
+4.624
7.53%
jan 1, 2013
64.21
-1.823
-2.76%
jan 1, 2014
66.325
+2.116
3.3%
Ranking of countries by current statistics by years


Comments: