29
/
en
AIzaSyAYiBZKx7MnpbEhh9jyipgxe19OcubqV5w
April 1, 2024
38007
IDA blend
IDB
false
2
1
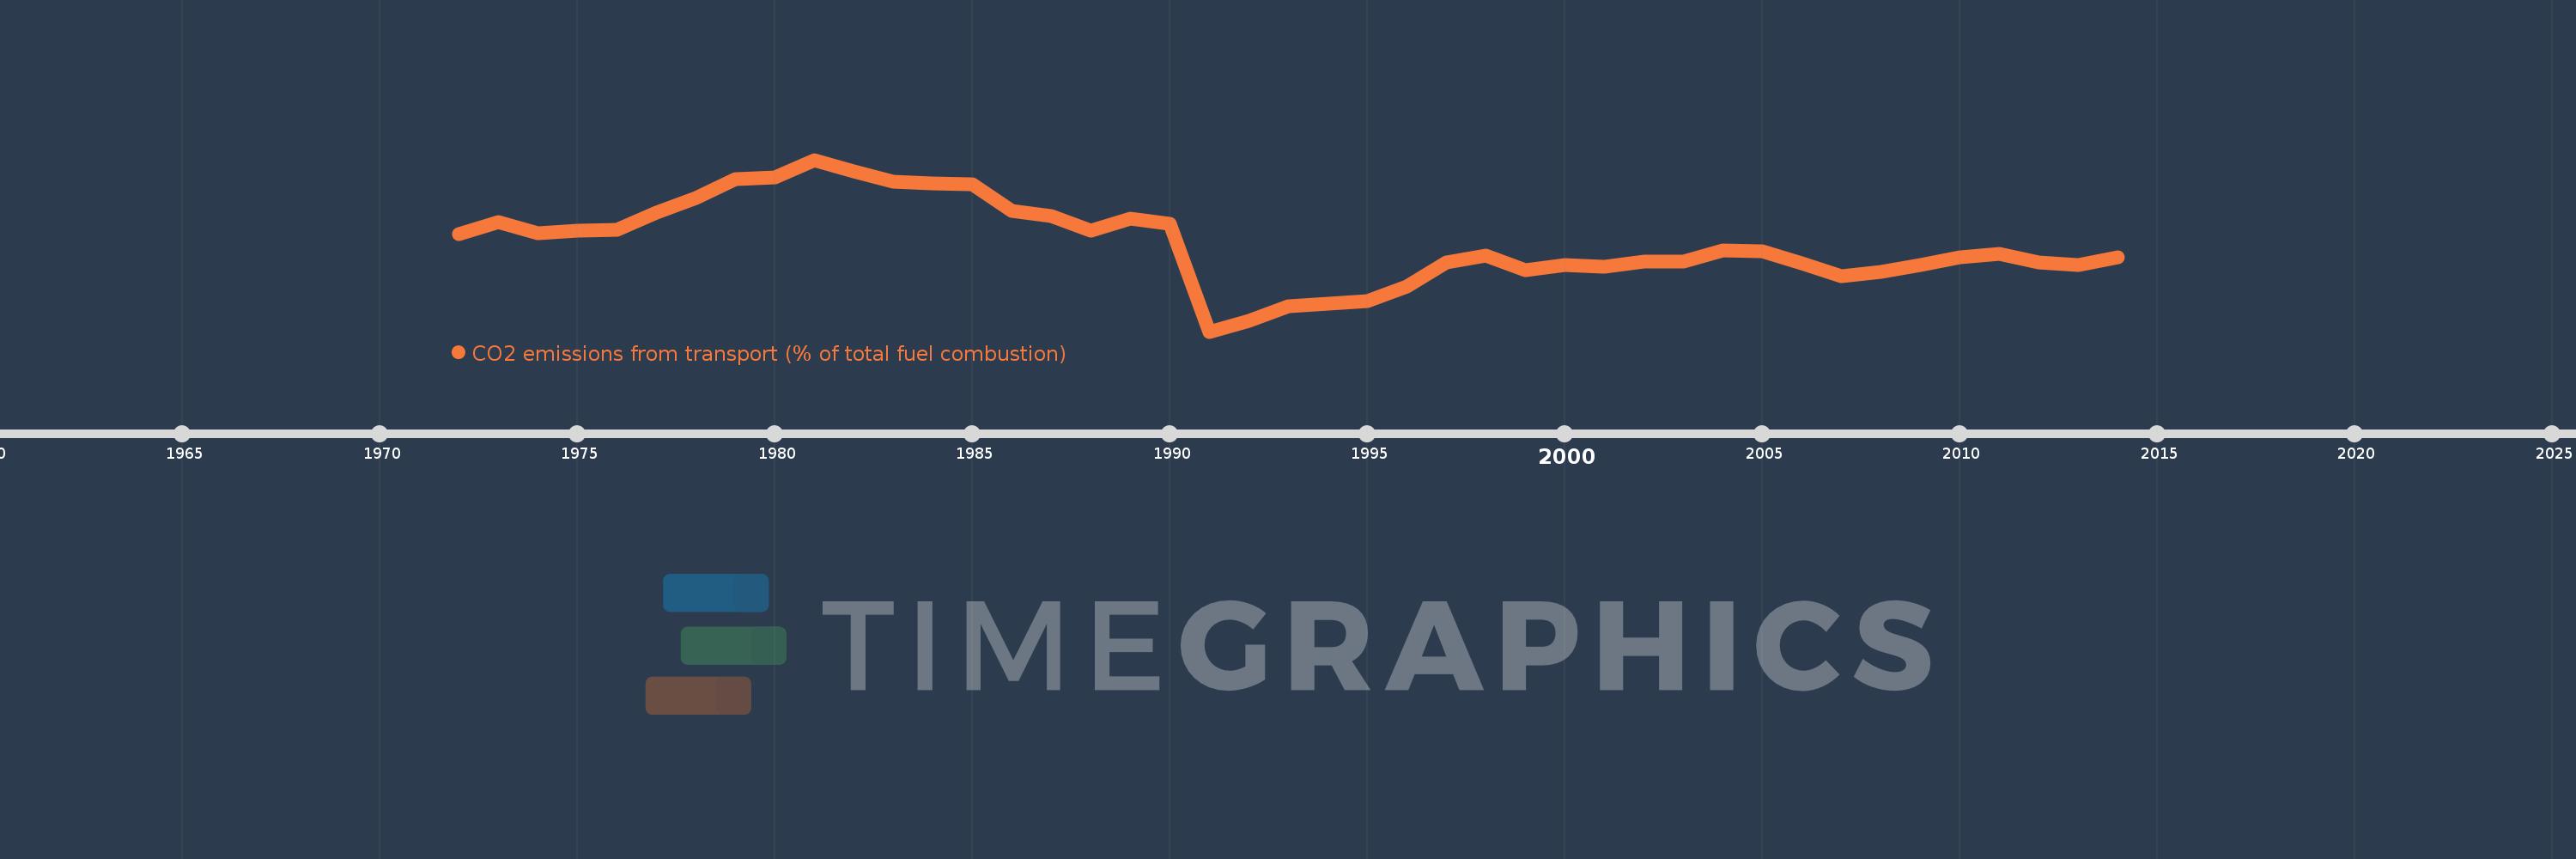
CO2 emissions from transport (% of total fuel combustion)
2014,2013,2012,2011,2010,2009,2008,2007,2006,2005,2004,2003,2002,2001,2000,1999,1998,1997,1996,1995,1994,1993,1992,1991,1990,1989,1988,1987,1986,1985,1984,1983,1982,1981,1980,1979,1978,1977,1976,1975,1974,1973,1972
This statistics in other country:
AlbaniaAlgeriaAngolaArab WorldArgentinaArmeniaAustraliaAustriaAzerbaijanBahrainBangladeshBelarusBelgiumBeninBoliviaBosnia and HerzegovinaBotswanaBrazilBrunei DarussalamBulgariaCambodiaCameroonCanadaCaribbean small statesCentral Europe and the BalticsChileChinaColombiaCongo, Dem. Rep.Congo, Rep.Costa RicaCote d'IvoireCroatiaCubaCuracaoCyprusCzech RepublicDenmarkDominican RepublicEarly-demographic dividendEast Asia & PacificEast Asia & Pacific (excluding high income)East Asia & Pacific (IDA & IBRD countries)EcuadorEgypt, Arab Rep.El SalvadorEritreaEstoniaEthiopiaEuro areaEurope & Central AsiaEurope & Central Asia (excluding high income)Europe & Central Asia (IDA & IBRD countries)European UnionFinlandFragile and conflict affected situationsFranceGabonGeorgiaGermanyGhanaGibraltarGreeceGuatemalaHaitiHeavily indebted poor countries (HIPC)High incomeHondurasHong Kong SAR, ChinaHungaryIBRD onlyIcelandIDA & IBRD totalIDA blendIDA onlyIDA totalIndiaIndonesiaIran, Islamic Rep.IraqIrelandIsraelItalyJamaicaJapanJordanKazakhstanKenyaKorea, Dem. People’s Rep.Korea, Rep.KosovoKuwaitKyrgyz RepublicLate-demographic dividendLatin America & Caribbean Latin America & Caribbean (excluding high income)Latin America & the Caribbean (IDA & IBRD countries)LatviaLeast developed countries: UN classificationLebanonLibyaLithuaniaLow & middle incomeLow incomeLower middle incomeLuxembourgMacedonia, FYRMalaysiaMaltaMauritiusMexicoMiddle East & North AfricaMiddle East & North Africa (excluding high income)Middle East & North Africa (IDA & IBRD countries)Middle incomeMoldovaMongoliaMontenegroMoroccoMozambiqueMyanmarNamibiaNepalNetherlandsNew ZealandNicaraguaNigerNigeriaNorth AmericaNorwayOECD membersOmanOther small statesPakistanPanamaParaguayPeruPhilippinesPolandPortugalPost-demographic dividendPre-demographic dividendQatarRomaniaRussian FederationSaudi ArabiaSenegalSerbiaSingaporeSlovak RepublicSloveniaSmall statesSouth AfricaSouth AsiaSouth Asia (IDA & IBRD)South SudanSpainSri LankaSub-Saharan Africa Sub-Saharan Africa (excluding high income)Sub-Saharan Africa (IDA & IBRD countries)SudanSwedenSwitzerlandSyrian Arab RepublicTajikistanTanzaniaThailandTogoTrinidad and TobagoTunisiaTurkeyTurkmenistanUkraineUnited Arab EmiratesUnited KingdomUnited StatesUpper middle incomeUruguayUzbekistanVenezuela, RBVietnamWorldYemen, Rep.ZambiaZimbabwe Timeline:
This timeline shows a graph from 1972 to 2014 of IDA blend. No data until 1971. Number of actual observations by date: 43.
Source name:
World Development Indicators
Source organization:
IEA Statistics © OECD/IEA 2014 (http://www.iea.org/stats/index.asp), subject to https://www.iea.org/t&c/termsandconditions/
Categories, topics:
Environment
Last updated:
apr 23, 2017
Indicators value changes by year
Minimum:
16.818
jan 1, 1991
Maximum:
36.243
jan 1, 1981
At the date of observation
Value
Absolute change
Change from previous value
jan 1, 1972
27.829
+27.829
0.0%
jan 1, 1973
29.159
+1.33
4.78%
jan 1, 1974
27.904
-1.255
-4.3%
jan 1, 1975
28.267
+0.362
1.3%
jan 1, 1976
28.285
+0.019
0.07%
jan 1, 1977
30.228
+1.943
6.87%
jan 1, 1978
31.936
+1.708
5.65%
jan 1, 1979
34.1
+2.164
6.78%
jan 1, 1980
34.287
+0.187
0.55%
jan 1, 1981
36.243
+1.956
5.7%
jan 1, 1982
34.895
-1.348
-3.72%
jan 1, 1983
33.793
-1.102
-3.16%
jan 1, 1984
33.619
-0.174
-0.51%
jan 1, 1985
33.509
-0.11
-0.33%
jan 1, 1986
30.509
-3.0
-8.95%
jan 1, 1987
29.855
-0.654
-2.14%
jan 1, 1988
28.211
-1.644
-5.51%
jan 1, 1989
29.595
+1.384
4.91%
jan 1, 1990
28.979
-0.617
-2.08%
jan 1, 1991
16.818
-12.161
-41.97%
jan 1, 1992
18.057
+1.239
7.37%
jan 1, 1993
19.693
+1.636
9.06%
jan 1, 1994
19.966
+0.273
1.39%
jan 1, 1995
20.219
+0.253
1.27%
jan 1, 1996
21.923
+1.704
8.43%
jan 1, 1997
24.626
+2.703
12.33%
jan 1, 1998
25.392
+0.766
3.11%
jan 1, 1999
23.748
-1.644
-6.48%
jan 1, 2000
24.312
+0.565
2.38%
jan 1, 2001
24.144
-0.168
-0.69%
jan 1, 2002
24.726
+0.582
2.41%
jan 1, 2003
24.707
-0.019
-0.08%
jan 1, 2004
25.971
+1.265
5.12%
jan 1, 2005
25.859
-0.112
-0.43%
jan 1, 2006
24.531
-1.328
-5.14%
jan 1, 2007
23.09
-1.441
-5.88%
jan 1, 2008
23.601
+0.511
2.21%
jan 1, 2009
24.327
+0.726
3.08%
jan 1, 2010
25.213
+0.887
3.64%
jan 1, 2011
25.649
+0.435
1.73%
jan 1, 2012
24.632
-1.017
-3.97%
jan 1, 2013
24.362
-0.27
-1.1%
jan 1, 2014
25.248
+0.887
3.64%
Ranking of countries by current statistics by years


Comments: