29
/
en
AIzaSyAYiBZKx7MnpbEhh9jyipgxe19OcubqV5w
April 1, 2024
86958
Bolivia
BOL
true
2
1
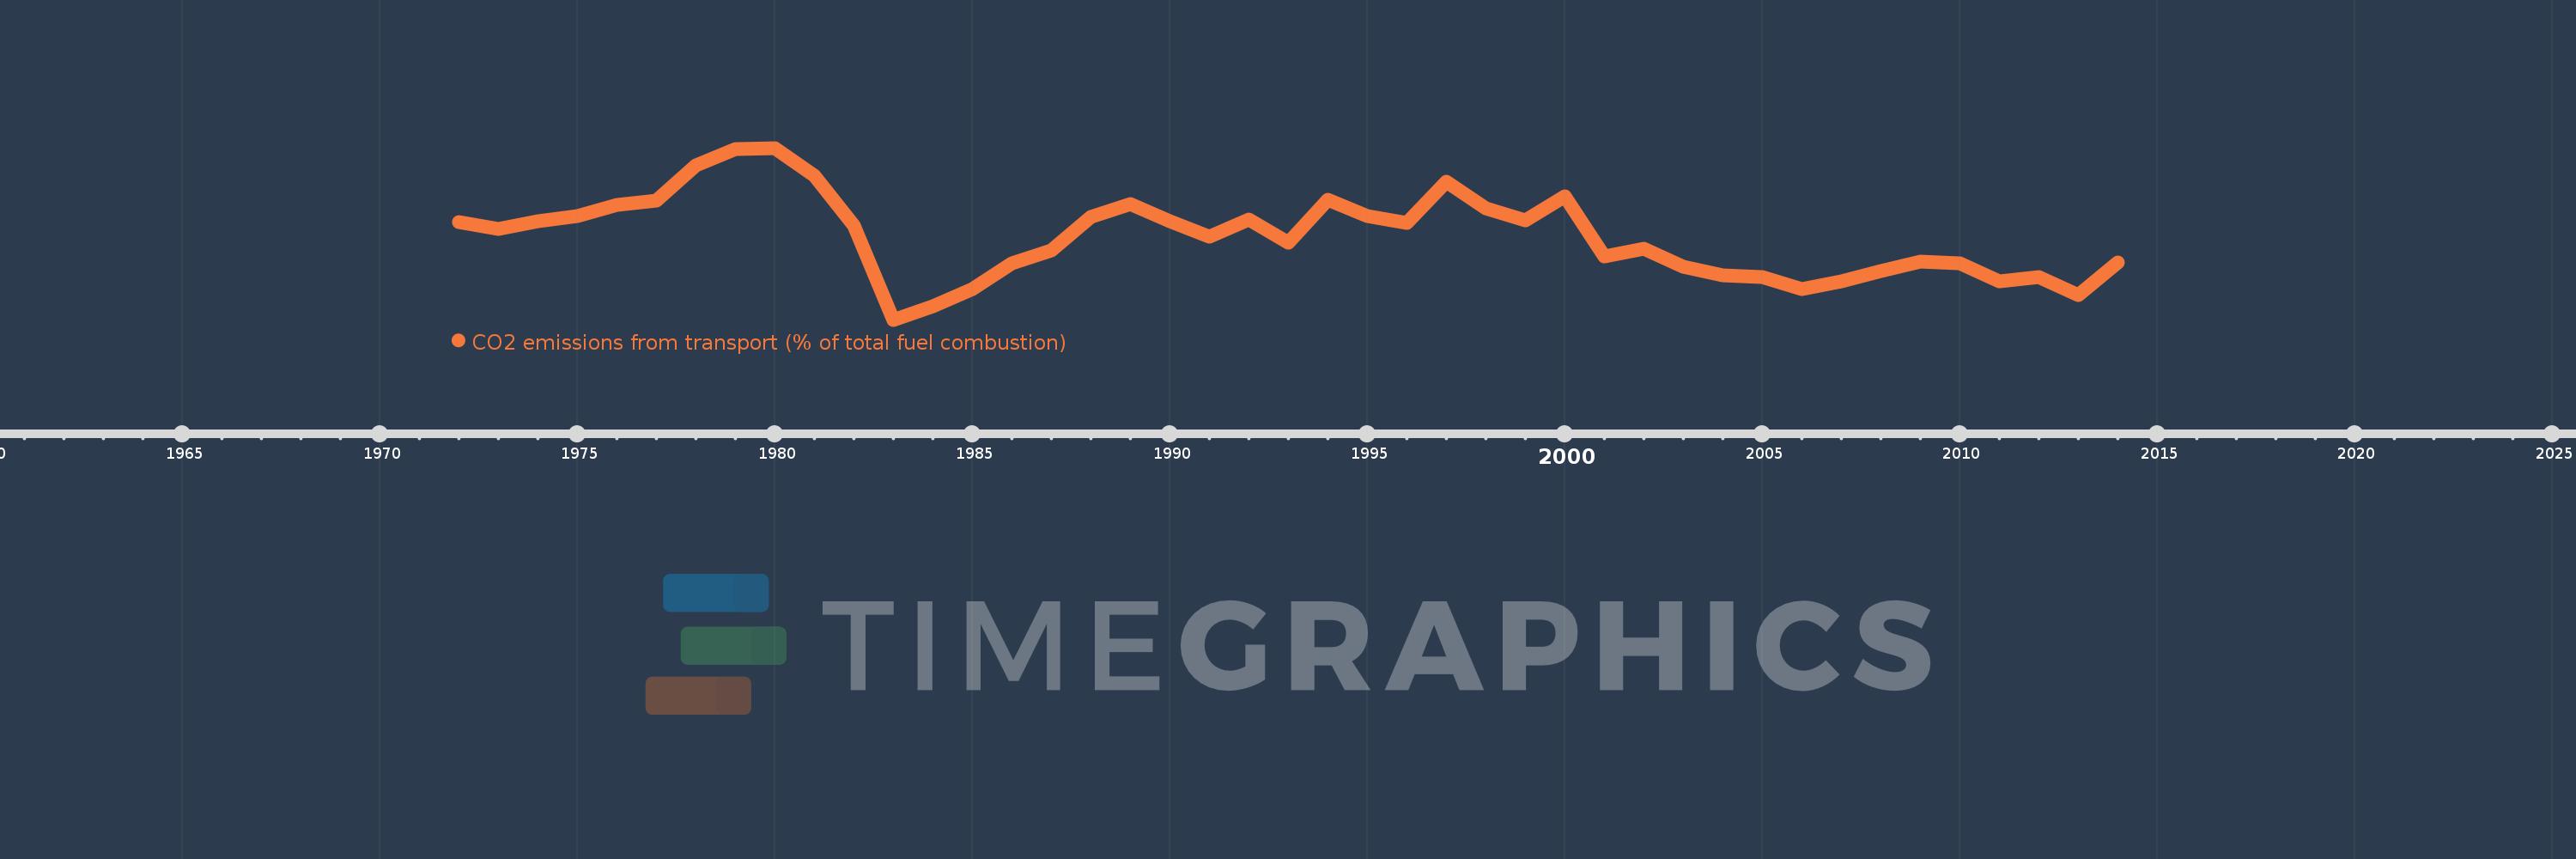
CO2 emissions from transport (% of total fuel combustion)
2014,2013,2012,2011,2010,2009,2008,2007,2006,2005,2004,2003,2002,2001,2000,1999,1998,1997,1996,1995,1994,1993,1992,1991,1990,1989,1988,1987,1986,1985,1984,1983,1982,1981,1980,1979,1978,1977,1976,1975,1974,1973,1972
This statistics in other country:
AlbaniaAlgeriaAngolaArab WorldArgentinaArmeniaAustraliaAustriaAzerbaijanBahrainBangladeshBelarusBelgiumBeninBoliviaBosnia and HerzegovinaBotswanaBrazilBrunei DarussalamBulgariaCambodiaCameroonCanadaCaribbean small statesCentral Europe and the BalticsChileChinaColombiaCongo, Dem. Rep.Congo, Rep.Costa RicaCote d'IvoireCroatiaCubaCuracaoCyprusCzech RepublicDenmarkDominican RepublicEarly-demographic dividendEast Asia & PacificEast Asia & Pacific (excluding high income)East Asia & Pacific (IDA & IBRD countries)EcuadorEgypt, Arab Rep.El SalvadorEritreaEstoniaEthiopiaEuro areaEurope & Central AsiaEurope & Central Asia (excluding high income)Europe & Central Asia (IDA & IBRD countries)European UnionFinlandFragile and conflict affected situationsFranceGabonGeorgiaGermanyGhanaGibraltarGreeceGuatemalaHaitiHeavily indebted poor countries (HIPC)High incomeHondurasHong Kong SAR, ChinaHungaryIBRD onlyIcelandIDA & IBRD totalIDA blendIDA onlyIDA totalIndiaIndonesiaIran, Islamic Rep.IraqIrelandIsraelItalyJamaicaJapanJordanKazakhstanKenyaKorea, Dem. People’s Rep.Korea, Rep.KosovoKuwaitKyrgyz RepublicLate-demographic dividendLatin America & Caribbean Latin America & Caribbean (excluding high income)Latin America & the Caribbean (IDA & IBRD countries)LatviaLeast developed countries: UN classificationLebanonLibyaLithuaniaLow & middle incomeLow incomeLower middle incomeLuxembourgMacedonia, FYRMalaysiaMaltaMauritiusMexicoMiddle East & North AfricaMiddle East & North Africa (excluding high income)Middle East & North Africa (IDA & IBRD countries)Middle incomeMoldovaMongoliaMontenegroMoroccoMozambiqueMyanmarNamibiaNepalNetherlandsNew ZealandNicaraguaNigerNigeriaNorth AmericaNorwayOECD membersOmanOther small statesPakistanPanamaParaguayPeruPhilippinesPolandPortugalPost-demographic dividendPre-demographic dividendQatarRomaniaRussian FederationSaudi ArabiaSenegalSerbiaSingaporeSlovak RepublicSloveniaSmall statesSouth AfricaSouth AsiaSouth Asia (IDA & IBRD)South SudanSpainSri LankaSub-Saharan Africa Sub-Saharan Africa (excluding high income)Sub-Saharan Africa (IDA & IBRD countries)SudanSwedenSwitzerlandSyrian Arab RepublicTajikistanTanzaniaThailandTogoTrinidad and TobagoTunisiaTurkeyTurkmenistanUkraineUnited Arab EmiratesUnited KingdomUnited StatesUpper middle incomeUruguayUzbekistanVenezuela, RBVietnamWorldYemen, Rep.ZambiaZimbabwe Timeline:
This timeline shows a graph from 1972 to 2014 of Bolivia. No data until 1971. Number of actual observations by date: 43.
Source name:
World Development Indicators
Source organization:
IEA Statistics © OECD/IEA 2014 (http://www.iea.org/stats/index.asp), subject to https://www.iea.org/t&c/termsandconditions/
Categories, topics:
Environment
Last updated:
apr 23, 2017
Indicators value changes by year
Minimum:
34.086
jan 1, 1983
Maximum:
53.186
jan 1, 1980
At the date of observation
Value
Absolute change
Change from previous value
jan 1, 1972
44.954
+44.954
0.0%
jan 1, 1973
44.167
-0.787
-1.75%
jan 1, 1974
45.059
+0.893
2.02%
jan 1, 1975
45.62
+0.561
1.25%
jan 1, 1976
46.894
+1.274
2.79%
jan 1, 1977
47.309
+0.414
0.88%
jan 1, 1978
51.2
+3.891
8.23%
jan 1, 1979
53.071
+1.871
3.65%
jan 1, 1980
53.186
+0.115
0.22%
jan 1, 1981
50.119
-3.068
-5.77%
jan 1, 1982
44.592
-5.527
-11.03%
jan 1, 1983
34.086
-10.505
-23.56%
jan 1, 1984
35.628
+1.541
4.52%
jan 1, 1985
37.473
+1.845
5.18%
jan 1, 1986
40.371
+2.898
7.73%
jan 1, 1987
41.827
+1.456
3.61%
jan 1, 1988
45.517
+3.69
8.82%
jan 1, 1989
46.948
+1.431
3.14%
jan 1, 1990
45.032
-1.917
-4.08%
jan 1, 1991
43.301
-1.731
-3.84%
jan 1, 1992
45.261
+1.96
4.53%
jan 1, 1993
42.699
-2.562
-5.66%
jan 1, 1994
47.425
+4.726
11.07%
jan 1, 1995
45.574
-1.851
-3.9%
jan 1, 1996
44.848
-0.726
-1.59%
jan 1, 1997
49.459
+4.611
10.28%
jan 1, 1998
46.462
-2.998
-6.06%
jan 1, 1999
45.101
-1.361
-2.93%
jan 1, 2000
47.786
+2.685
5.95%
jan 1, 2001
41.094
-6.692
-14.0%
jan 1, 2002
41.959
+0.865
2.11%
jan 1, 2003
39.945
-2.014
-4.8%
jan 1, 2004
39.021
-0.924
-2.31%
jan 1, 2005
38.876
-0.145
-0.37%
jan 1, 2006
37.46
-1.416
-3.64%
jan 1, 2007
38.402
+0.941
2.51%
jan 1, 2008
39.464
+1.063
2.77%
jan 1, 2009
40.592
+1.127
2.86%
jan 1, 2010
40.407
-0.184
-0.45%
jan 1, 2011
38.396
-2.011
-4.98%
jan 1, 2012
38.874
+0.478
1.25%
jan 1, 2013
36.802
-2.072
-5.33%
jan 1, 2014
40.439
+3.637
9.88%
Ranking of countries by current statistics by years


Comments: