29
/
en
AIzaSyAYiBZKx7MnpbEhh9jyipgxe19OcubqV5w
April 1, 2024
159223
Ireland
IRL
true
2
1
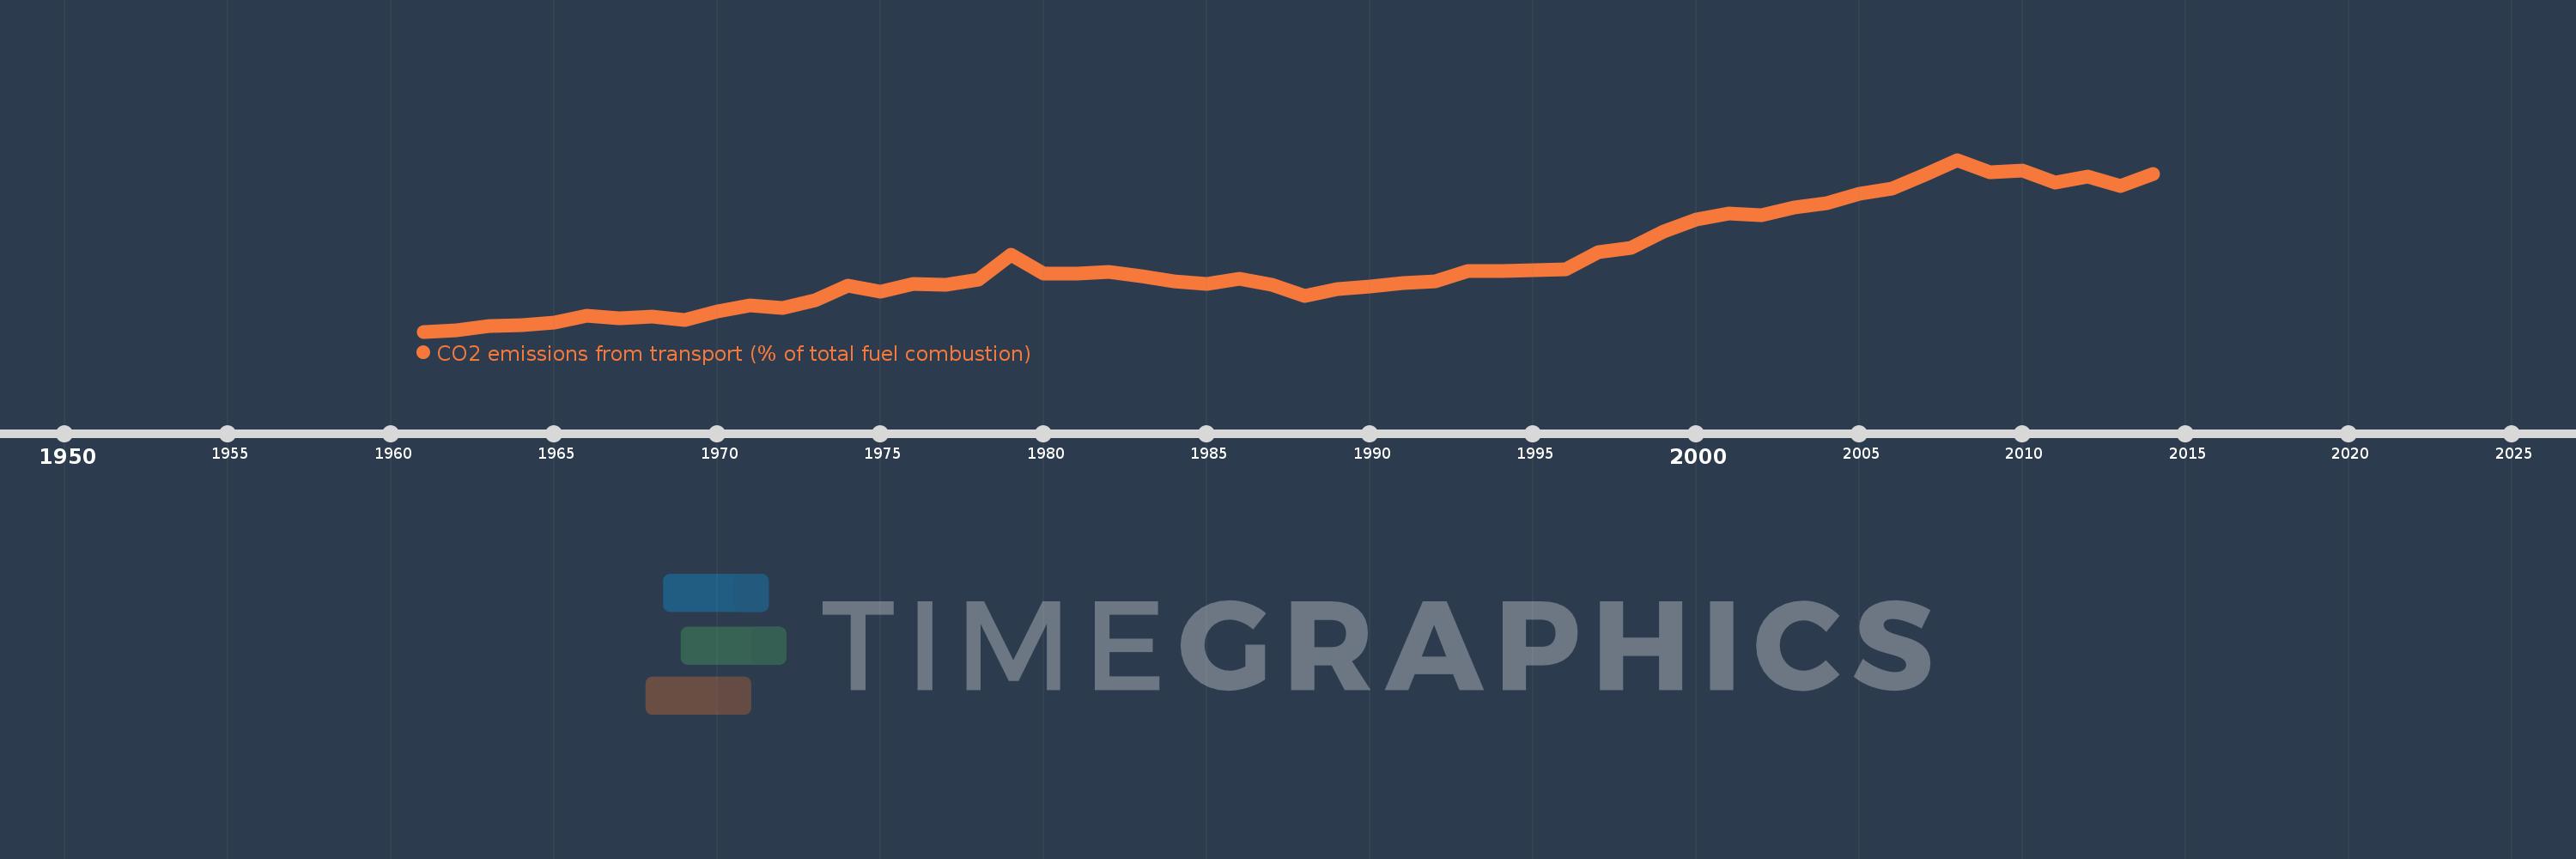
CO2 emissions from transport (% of total fuel combustion)
2014,2013,2012,2011,2010,2009,2008,2007,2006,2005,2004,2003,2002,2001,2000,1999,1998,1997,1996,1995,1994,1993,1992,1991,1990,1989,1988,1987,1986,1985,1984,1983,1982,1981,1980,1979,1978,1977,1976,1975,1974,1973,1972,1971,1970,1969,1968,1967,1966,1965,1964,1963,1962,1961
This statistics in other country:
AlbaniaAlgeriaAngolaArab WorldArgentinaArmeniaAustraliaAustriaAzerbaijanBahrainBangladeshBelarusBelgiumBeninBoliviaBosnia and HerzegovinaBotswanaBrazilBrunei DarussalamBulgariaCambodiaCameroonCanadaCaribbean small statesCentral Europe and the BalticsChileChinaColombiaCongo, Dem. Rep.Congo, Rep.Costa RicaCote d'IvoireCroatiaCubaCuracaoCyprusCzech RepublicDenmarkDominican RepublicEarly-demographic dividendEast Asia & PacificEast Asia & Pacific (excluding high income)East Asia & Pacific (IDA & IBRD countries)EcuadorEgypt, Arab Rep.El SalvadorEritreaEstoniaEthiopiaEuro areaEurope & Central AsiaEurope & Central Asia (excluding high income)Europe & Central Asia (IDA & IBRD countries)European UnionFinlandFragile and conflict affected situationsFranceGabonGeorgiaGermanyGhanaGibraltarGreeceGuatemalaHaitiHeavily indebted poor countries (HIPC)High incomeHondurasHong Kong SAR, ChinaHungaryIBRD onlyIcelandIDA & IBRD totalIDA blendIDA onlyIDA totalIndiaIndonesiaIran, Islamic Rep.IraqIrelandIsraelItalyJamaicaJapanJordanKazakhstanKenyaKorea, Dem. People’s Rep.Korea, Rep.KosovoKuwaitKyrgyz RepublicLate-demographic dividendLatin America & Caribbean Latin America & Caribbean (excluding high income)Latin America & the Caribbean (IDA & IBRD countries)LatviaLeast developed countries: UN classificationLebanonLibyaLithuaniaLow & middle incomeLow incomeLower middle incomeLuxembourgMacedonia, FYRMalaysiaMaltaMauritiusMexicoMiddle East & North AfricaMiddle East & North Africa (excluding high income)Middle East & North Africa (IDA & IBRD countries)Middle incomeMoldovaMongoliaMontenegroMoroccoMozambiqueMyanmarNamibiaNepalNetherlandsNew ZealandNicaraguaNigerNigeriaNorth AmericaNorwayOECD membersOmanOther small statesPakistanPanamaParaguayPeruPhilippinesPolandPortugalPost-demographic dividendPre-demographic dividendQatarRomaniaRussian FederationSaudi ArabiaSenegalSerbiaSingaporeSlovak RepublicSloveniaSmall statesSouth AfricaSouth AsiaSouth Asia (IDA & IBRD)South SudanSpainSri LankaSub-Saharan Africa Sub-Saharan Africa (excluding high income)Sub-Saharan Africa (IDA & IBRD countries)SudanSwedenSwitzerlandSyrian Arab RepublicTajikistanTanzaniaThailandTogoTrinidad and TobagoTunisiaTurkeyTurkmenistanUkraineUnited Arab EmiratesUnited KingdomUnited StatesUpper middle incomeUruguayUzbekistanVenezuela, RBVietnamWorldYemen, Rep.ZambiaZimbabwe Timeline:
This timeline shows a graph from 1961 to 2014 of Ireland. No data until 1960. Number of actual observations by date: 54.
Source name:
World Development Indicators
Source organization:
IEA Statistics © OECD/IEA 2014 (http://www.iea.org/stats/index.asp), subject to https://www.iea.org/t&c/termsandconditions/
Categories, topics:
Environment
Last updated:
apr 23, 2017
Indicators value changes by year
Minimum:
10.038
jan 1, 1961
Maximum:
32.261
jan 1, 2008
At the date of observation
Value
Absolute change
Change from previous value
jan 1, 1961
10.038
+10.038
0.0%
jan 1, 1962
10.225
+0.186
1.86%
jan 1, 1963
10.791
+0.567
5.54%
jan 1, 1964
10.832
+0.04
0.37%
jan 1, 1965
11.216
+0.385
3.55%
jan 1, 1966
12.115
+0.899
8.01%
jan 1, 1967
11.783
-0.331
-2.74%
jan 1, 1968
11.962
+0.179
1.52%
jan 1, 1969
11.487
-0.475
-3.97%
jan 1, 1970
12.642
+1.155
10.06%
jan 1, 1971
13.395
+0.753
5.95%
jan 1, 1972
13.078
-0.317
-2.37%
jan 1, 1973
14.119
+1.041
7.96%
jan 1, 1974
15.994
+1.875
13.28%
jan 1, 1975
15.184
-0.811
-5.07%
jan 1, 1976
16.225
+1.041
6.86%
jan 1, 1977
16.095
-0.13
-0.8%
jan 1, 1978
16.738
+0.643
3.99%
jan 1, 1979
19.957
+3.219
19.23%
jan 1, 1980
17.493
-2.464
-12.35%
jan 1, 1981
17.574
+0.082
0.47%
jan 1, 1982
17.75
+0.176
1.0%
jan 1, 1983
17.175
-0.576
-3.24%
jan 1, 1984
16.521
-0.654
-3.81%
jan 1, 1985
16.185
-0.336
-2.03%
jan 1, 1986
16.862
+0.677
4.18%
jan 1, 1987
16.06
-0.802
-4.76%
jan 1, 1988
14.605
-1.455
-9.06%
jan 1, 1989
15.516
+0.911
6.24%
jan 1, 1990
15.908
+0.392
2.53%
jan 1, 1991
16.274
+0.365
2.3%
jan 1, 1992
16.569
+0.295
1.81%
jan 1, 1993
17.84
+1.271
7.67%
jan 1, 1994
17.844
+0.005
0.03%
jan 1, 1995
18.009
+0.164
0.92%
jan 1, 1996
18.082
+0.073
0.4%
jan 1, 1997
20.365
+2.283
12.63%
jan 1, 1998
20.835
+0.47
2.31%
jan 1, 1999
23.005
+2.171
10.42%
jan 1, 2000
24.501
+1.496
6.5%
jan 1, 2001
25.3
+0.799
3.26%
jan 1, 2002
25.116
-0.184
-0.73%
jan 1, 2003
26.117
+1.001
3.98%
jan 1, 2004
26.614
+0.497
1.9%
jan 1, 2005
27.891
+1.276
4.8%
jan 1, 2006
28.594
+0.704
2.52%
jan 1, 2007
30.347
+1.753
6.13%
jan 1, 2008
32.261
+1.914
6.31%
jan 1, 2009
30.654
-1.607
-4.98%
jan 1, 2010
30.851
+0.197
0.64%
jan 1, 2011
29.341
-1.51
-4.89%
jan 1, 2012
30.125
+0.783
2.67%
jan 1, 2013
28.919
-1.206
-4.0%
jan 1, 2014
30.384
+1.465
5.07%
Ranking of countries by current statistics by years


Comments: