29
/
en
AIzaSyAYiBZKx7MnpbEhh9jyipgxe19OcubqV5w
April 1, 2024
87554
Bolivia
BOL
true
2
1
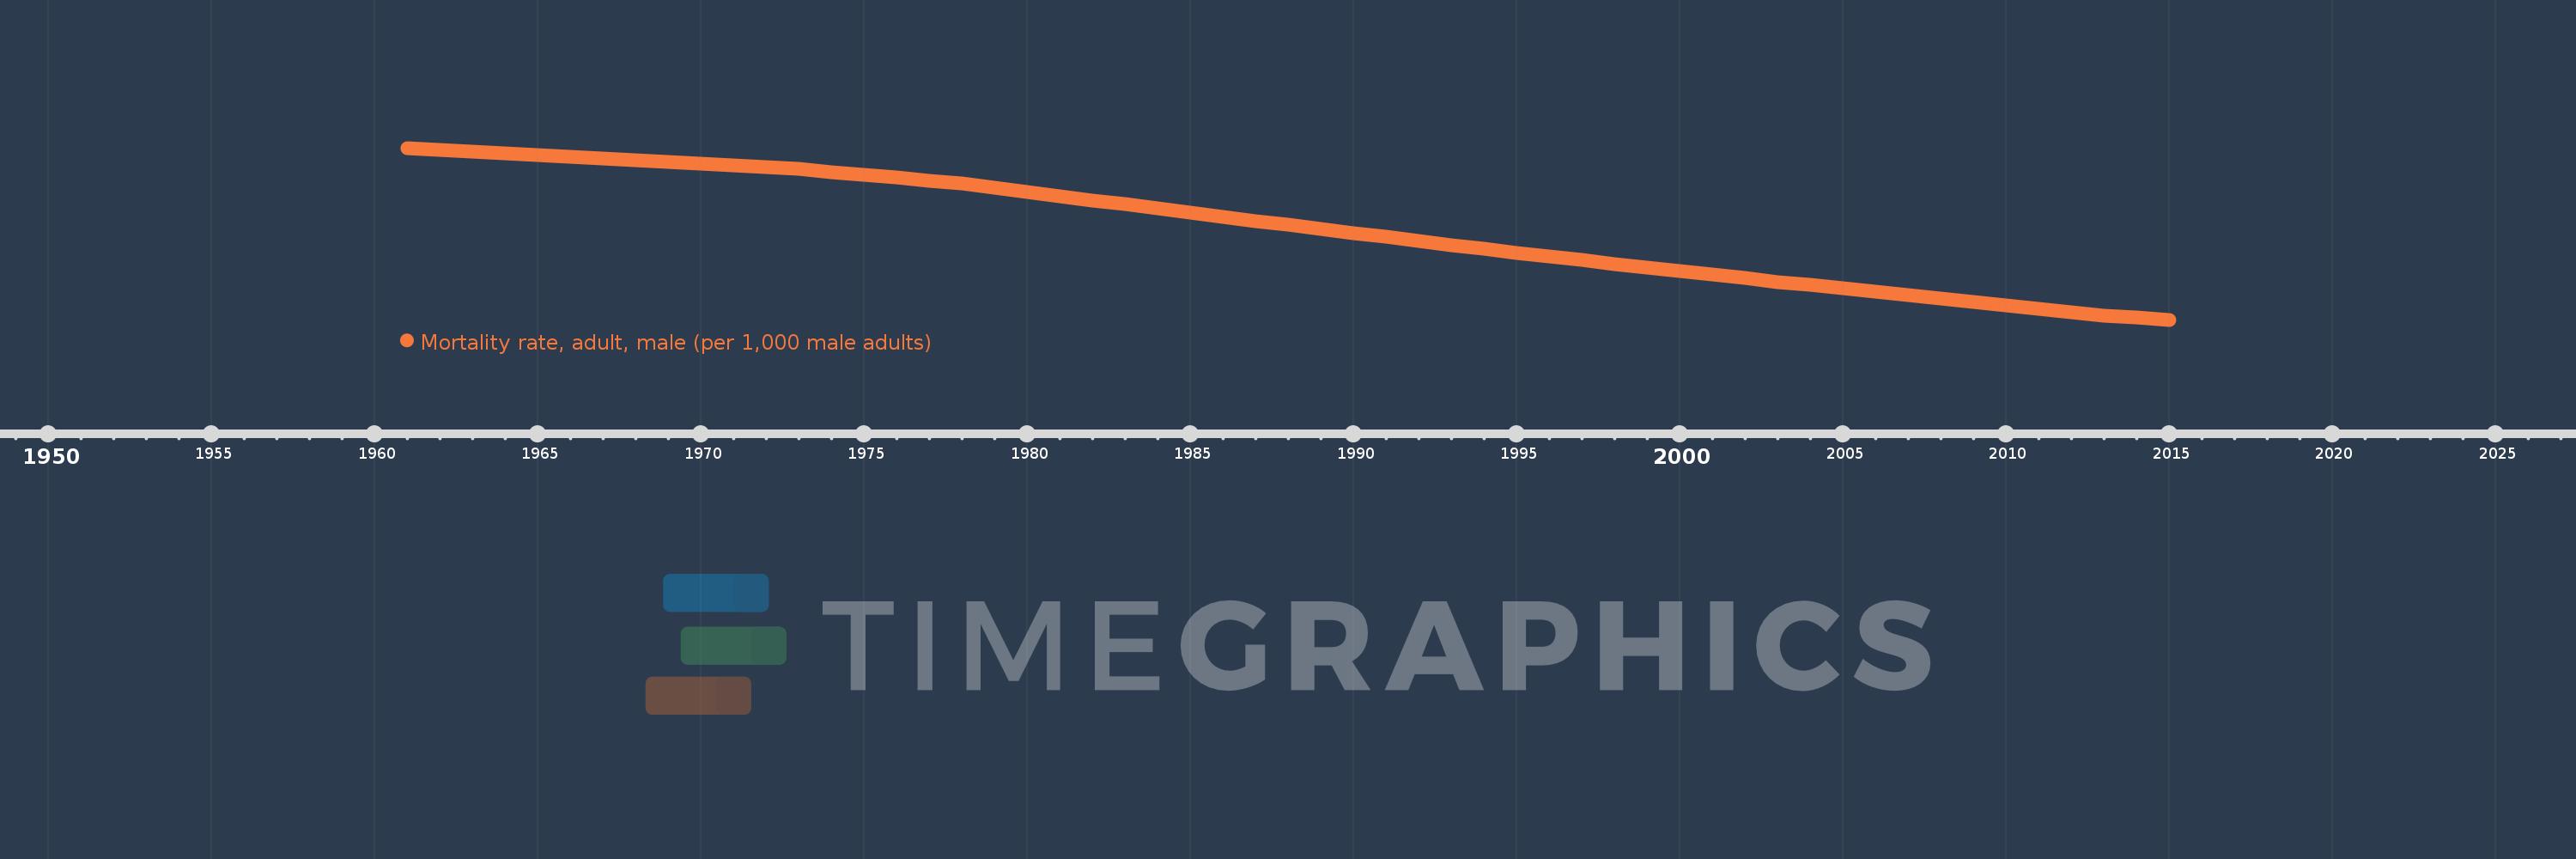
Mortality rate, adult, male (per 1,000 male adults)
2015,2014,2013,2012,2011,2010,2009,2008,2007,2006,2005,2004,2003,2002,2001,2000,1999,1998,1997,1996,1995,1994,1993,1992,1991,1990,1989,1988,1987,1986,1985,1984,1983,1982,1981,1980,1979,1978,1977,1976,1975,1974,1973,1972,1971,1970,1969,1968,1967,1966,1965,1964,1963,1962,1961
This statistics in other country:
AfghanistanAlbaniaAlgeriaAngolaAntigua and BarbudaArab WorldArgentinaArmeniaArubaAustraliaAustriaAzerbaijanBahamas, TheBahrainBangladeshBarbadosBelarusBelgiumBelizeBeninBhutanBoliviaBosnia and HerzegovinaBotswanaBrazilBrunei DarussalamBulgariaBurkina FasoBurundiCabo VerdeCambodiaCameroonCanadaCaribbean small statesCentral African RepublicCentral Europe and the BalticsChadChannel IslandsChileChinaColombiaComorosCongo, Dem. Rep.Congo, Rep.Costa RicaCote d'IvoireCroatiaCubaCuracaoCyprusCzech RepublicDenmarkDjiboutiDominicaDominican RepublicEarly-demographic dividendEast Asia & PacificEast Asia & Pacific (excluding high income)East Asia & Pacific (IDA & IBRD countries)EcuadorEgypt, Arab Rep.El SalvadorEquatorial GuineaEritreaEstoniaEthiopiaEuro areaEurope & Central AsiaEurope & Central Asia (excluding high income)Europe & Central Asia (IDA & IBRD countries)European UnionFijiFinlandFragile and conflict affected situationsFranceFrench PolynesiaGabonGambia, TheGeorgiaGermanyGhanaGreeceGreenlandGrenadaGuamGuatemalaGuineaGuinea-BissauGuyanaHaitiHeavily indebted poor countries (HIPC)High incomeHondurasHong Kong SAR, ChinaHungaryIBRD onlyIcelandIDA & IBRD totalIDA blendIDA onlyIDA totalIndiaIndonesiaIran, Islamic Rep.IraqIrelandIsraelItalyJamaicaJapanJordanKazakhstanKenyaKiribatiKorea, Dem. People’s Rep.Korea, Rep.KuwaitKyrgyz RepublicLao PDRLate-demographic dividendLatin America & Caribbean Latin America & Caribbean (excluding high income)Latin America & the Caribbean (IDA & IBRD countries)LatviaLeast developed countries: UN classificationLebanonLesothoLiberiaLibyaLithuaniaLow & middle incomeLow incomeLower middle incomeLuxembourgMacao SAR, ChinaMacedonia, FYRMadagascarMalawiMalaysiaMaldivesMaliMaltaMarshall IslandsMauritaniaMauritiusMexicoMicronesia, Fed. Sts.Middle East & North AfricaMiddle East & North Africa (excluding high income)Middle East & North Africa (IDA & IBRD countries)Middle incomeMoldovaMongoliaMontenegroMoroccoMozambiqueMyanmarNamibiaNepalNetherlandsNew CaledoniaNew ZealandNicaraguaNigerNigeriaNorth AmericaNorwayOECD membersOmanOther small statesPacific island small statesPakistanPanamaPapua New GuineaParaguayPeruPhilippinesPolandPortugalPost-demographic dividendPre-demographic dividendPuerto RicoQatarRomaniaRussian FederationRwandaSamoaSao Tome and PrincipeSaudi ArabiaSenegalSerbiaSeychellesSierra LeoneSingaporeSlovak RepublicSloveniaSmall statesSolomon IslandsSomaliaSouth AfricaSouth AsiaSouth Asia (IDA & IBRD)South SudanSpainSri LankaSt. Kitts and NevisSt. LuciaSt. Vincent and the GrenadinesSub-Saharan Africa Sub-Saharan Africa (excluding high income)Sub-Saharan Africa (IDA & IBRD countries)SudanSurinameSwazilandSwedenSwitzerlandSyrian Arab RepublicTajikistanTanzaniaThailandTimor-LesteTogoTongaTrinidad and TobagoTunisiaTurkeyTurkmenistanUgandaUkraineUnited Arab EmiratesUnited KingdomUnited StatesUpper middle incomeUruguayUzbekistanVanuatuVenezuela, RBVietnamVirgin Islands (U.S.)West Bank and GazaWorldYemen, Rep.ZambiaZimbabwe Timeline:
This timeline shows a graph from 1961 to 2015 of Bolivia. No data until 1960. Number of actual observations by date: 55.
Source name:
World Development Indicators
Source organization:
(1) United Nations Population Division. World Population Prospects. New York, United Nations, Department of Economic and Social Affairs (advanced Excel tables). Available at http://esa.un.org/wpp/unpp/panel_population.htm, (2) University of California, Berkeley, and Max Planck Institute for Demographic Research. Human Mortality Database. [ www.mortality.org or www.humanmortality.de].
Categories, topics:
Health, Gender
Last updated:
apr 23, 2017
Indicators value changes by year
Minimum:
219.081
jan 1, 2015
Maximum:
421.504
jan 1, 1961
At the date of observation
Value
Absolute change
Change from previous value
jan 1, 1961
421.504
+421.504
0.0%
jan 1, 1962
419.215
-2.289
-0.54%
jan 1, 1963
416.927
-2.288
-0.55%
jan 1, 1964
414.905
-2.022
-0.48%
jan 1, 1965
412.884
-2.021
-0.49%
jan 1, 1966
410.862
-2.022
-0.49%
jan 1, 1967
408.84
-2.022
-0.49%
jan 1, 1968
406.819
-2.021
-0.49%
jan 1, 1969
404.786
-2.033
-0.5%
jan 1, 1970
402.754
-2.032
-0.5%
jan 1, 1971
400.722
-2.032
-0.5%
jan 1, 1972
398.69
-2.032
-0.51%
jan 1, 1973
396.657
-2.033
-0.51%
jan 1, 1974
393.281
-3.376
-0.85%
jan 1, 1975
389.905
-3.376
-0.86%
jan 1, 1976
386.528
-3.377
-0.87%
jan 1, 1977
383.152
-3.376
-0.87%
jan 1, 1978
379.776
-3.376
-0.88%
jan 1, 1979
374.808
-4.968
-1.31%
jan 1, 1980
369.84
-4.968
-1.33%
jan 1, 1981
364.872
-4.968
-1.34%
jan 1, 1982
359.903
-4.969
-1.36%
jan 1, 1983
354.935
-4.968
-1.38%
jan 1, 1984
350.079
-4.856
-1.37%
jan 1, 1985
345.223
-4.856
-1.39%
jan 1, 1986
340.368
-4.855
-1.41%
jan 1, 1987
335.512
-4.856
-1.43%
jan 1, 1988
330.656
-4.856
-1.45%
jan 1, 1989
325.961
-4.695
-1.42%
jan 1, 1990
321.267
-4.694
-1.44%
jan 1, 1991
316.573
-4.694
-1.46%
jan 1, 1992
311.878
-4.695
-1.48%
jan 1, 1993
307.184
-4.694
-1.51%
jan 1, 1994
302.697
-4.487
-1.46%
jan 1, 1995
298.209
-4.488
-1.48%
jan 1, 1996
293.722
-4.487
-1.5%
jan 1, 1997
289.235
-4.487
-1.53%
jan 1, 1998
284.747
-4.488
-1.55%
jan 1, 1999
280.535
-4.212
-1.48%
jan 1, 2000
276.323
-4.212
-1.5%
jan 1, 2001
272.111
-4.212
-1.52%
jan 1, 2002
267.9
-4.211
-1.55%
jan 1, 2003
263.688
-4.212
-1.57%
jan 1, 2004
259.836
-3.852
-1.46%
jan 1, 2005
255.983
-3.853
-1.48%
jan 1, 2006
252.131
-3.852
-1.5%
jan 1, 2007
248.279
-3.852
-1.53%
jan 1, 2008
244.427
-3.852
-1.55%
jan 1, 2009
240.307
-4.12
-1.69%
jan 1, 2010
236.186
-4.121
-1.71%
jan 1, 2011
232.066
-4.12
-1.74%
jan 1, 2012
227.946
-4.12
-1.78%
jan 1, 2013
223.826
-4.12
-1.81%
jan 1, 2014
221.453
-2.373
-1.06%
jan 1, 2015
219.081
-2.372
-1.07%
Ranking of countries by current statistics by years


Comments: