29
/
en
AIzaSyAYiBZKx7MnpbEhh9jyipgxe19OcubqV5w
April 1, 2024
180170
Libya
LBY
true
2
1
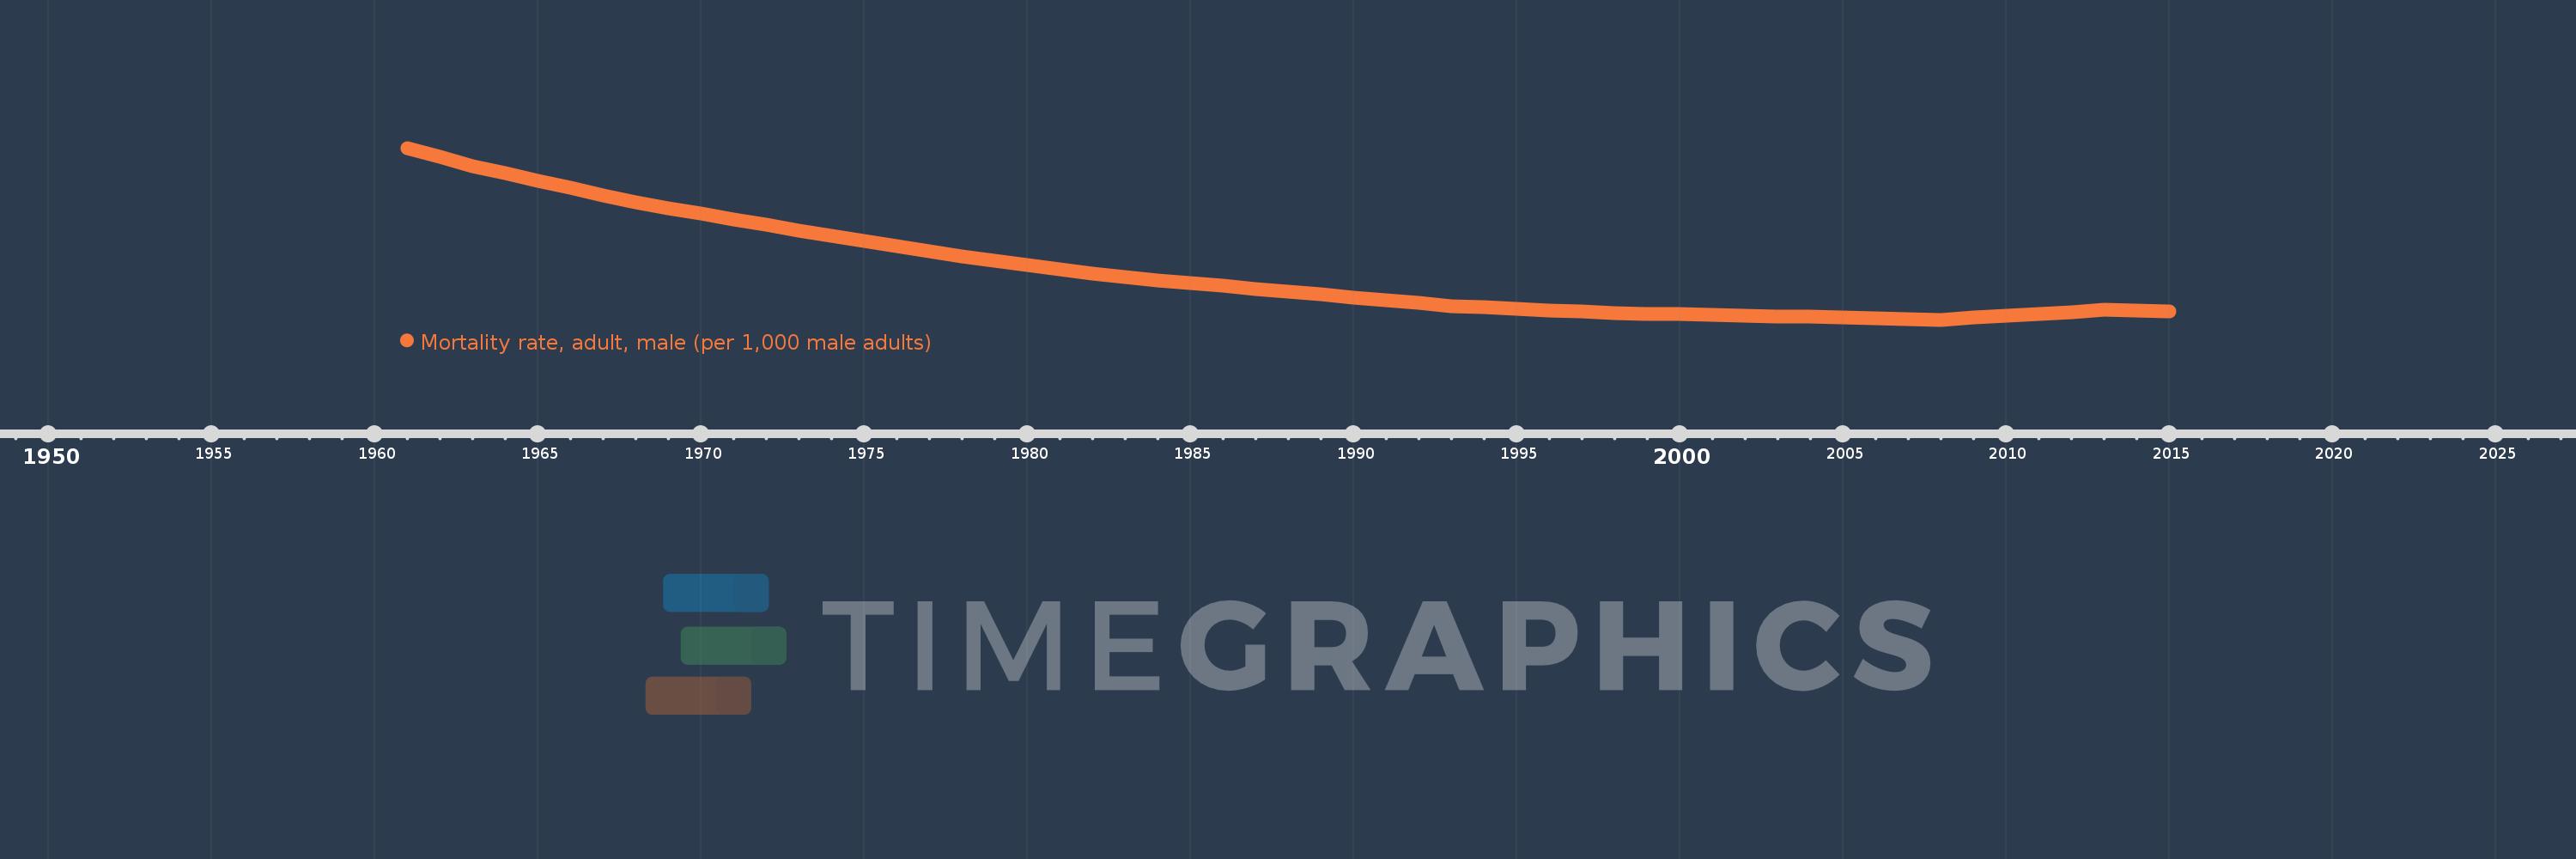
Mortality rate, adult, male (per 1,000 male adults)
2015,2014,2013,2012,2011,2010,2009,2008,2007,2006,2005,2004,2003,2002,2001,2000,1999,1998,1997,1996,1995,1994,1993,1992,1991,1990,1989,1988,1987,1986,1985,1984,1983,1982,1981,1980,1979,1978,1977,1976,1975,1974,1973,1972,1971,1970,1969,1968,1967,1966,1965,1964,1963,1962,1961
This statistics in other country:
AfghanistanAlbaniaAlgeriaAngolaAntigua and BarbudaArab WorldArgentinaArmeniaArubaAustraliaAustriaAzerbaijanBahamas, TheBahrainBangladeshBarbadosBelarusBelgiumBelizeBeninBhutanBoliviaBosnia and HerzegovinaBotswanaBrazilBrunei DarussalamBulgariaBurkina FasoBurundiCabo VerdeCambodiaCameroonCanadaCaribbean small statesCentral African RepublicCentral Europe and the BalticsChadChannel IslandsChileChinaColombiaComorosCongo, Dem. Rep.Congo, Rep.Costa RicaCote d'IvoireCroatiaCubaCuracaoCyprusCzech RepublicDenmarkDjiboutiDominicaDominican RepublicEarly-demographic dividendEast Asia & PacificEast Asia & Pacific (excluding high income)East Asia & Pacific (IDA & IBRD countries)EcuadorEgypt, Arab Rep.El SalvadorEquatorial GuineaEritreaEstoniaEthiopiaEuro areaEurope & Central AsiaEurope & Central Asia (excluding high income)Europe & Central Asia (IDA & IBRD countries)European UnionFijiFinlandFragile and conflict affected situationsFranceFrench PolynesiaGabonGambia, TheGeorgiaGermanyGhanaGreeceGreenlandGrenadaGuamGuatemalaGuineaGuinea-BissauGuyanaHaitiHeavily indebted poor countries (HIPC)High incomeHondurasHong Kong SAR, ChinaHungaryIBRD onlyIcelandIDA & IBRD totalIDA blendIDA onlyIDA totalIndiaIndonesiaIran, Islamic Rep.IraqIrelandIsraelItalyJamaicaJapanJordanKazakhstanKenyaKiribatiKorea, Dem. People’s Rep.Korea, Rep.KuwaitKyrgyz RepublicLao PDRLate-demographic dividendLatin America & Caribbean Latin America & Caribbean (excluding high income)Latin America & the Caribbean (IDA & IBRD countries)LatviaLeast developed countries: UN classificationLebanonLesothoLiberiaLibyaLithuaniaLow & middle incomeLow incomeLower middle incomeLuxembourgMacao SAR, ChinaMacedonia, FYRMadagascarMalawiMalaysiaMaldivesMaliMaltaMarshall IslandsMauritaniaMauritiusMexicoMicronesia, Fed. Sts.Middle East & North AfricaMiddle East & North Africa (excluding high income)Middle East & North Africa (IDA & IBRD countries)Middle incomeMoldovaMongoliaMontenegroMoroccoMozambiqueMyanmarNamibiaNepalNetherlandsNew CaledoniaNew ZealandNicaraguaNigerNigeriaNorth AmericaNorwayOECD membersOmanOther small statesPacific island small statesPakistanPanamaPapua New GuineaParaguayPeruPhilippinesPolandPortugalPost-demographic dividendPre-demographic dividendPuerto RicoQatarRomaniaRussian FederationRwandaSamoaSao Tome and PrincipeSaudi ArabiaSenegalSerbiaSeychellesSierra LeoneSingaporeSlovak RepublicSloveniaSmall statesSolomon IslandsSomaliaSouth AfricaSouth AsiaSouth Asia (IDA & IBRD)South SudanSpainSri LankaSt. Kitts and NevisSt. LuciaSt. Vincent and the GrenadinesSub-Saharan Africa Sub-Saharan Africa (excluding high income)Sub-Saharan Africa (IDA & IBRD countries)SudanSurinameSwazilandSwedenSwitzerlandSyrian Arab RepublicTajikistanTanzaniaThailandTimor-LesteTogoTongaTrinidad and TobagoTunisiaTurkeyTurkmenistanUgandaUkraineUnited Arab EmiratesUnited KingdomUnited StatesUpper middle incomeUruguayUzbekistanVanuatuVenezuela, RBVietnamVirgin Islands (U.S.)West Bank and GazaWorldYemen, Rep.ZambiaZimbabwe Timeline:
This timeline shows a graph from 1961 to 2015 of Libya. No data until 1960. Number of actual observations by date: 55.
Source name:
World Development Indicators
Source organization:
(1) United Nations Population Division. World Population Prospects. New York, United Nations, Department of Economic and Social Affairs (advanced Excel tables). Available at http://esa.un.org/wpp/unpp/panel_population.htm, (2) University of California, Berkeley, and Max Planck Institute for Demographic Research. Human Mortality Database. [ www.mortality.org or www.humanmortality.de].
Categories, topics:
Health, Gender
Last updated:
apr 23, 2017
Indicators value changes by year
Minimum:
161.224
jan 1, 2008
Maximum:
418.463
jan 1, 1961
At the date of observation
Value
Absolute change
Change from previous value
jan 1, 1961
418.463
+418.463
0.0%
jan 1, 1962
405.003
-13.46
-3.22%
jan 1, 1963
391.543
-13.46
-3.32%
jan 1, 1964
380.612
-10.931
-2.79%
jan 1, 1965
369.681
-10.931
-2.87%
jan 1, 1966
358.75
-10.931
-2.96%
jan 1, 1967
347.819
-10.931
-3.05%
jan 1, 1968
336.888
-10.931
-3.14%
jan 1, 1969
328.458
-8.43
-2.5%
jan 1, 1970
320.027
-8.431
-2.57%
jan 1, 1971
311.597
-8.43
-2.63%
jan 1, 1972
303.166
-8.431
-2.71%
jan 1, 1973
294.736
-8.43
-2.78%
jan 1, 1974
286.953
-7.783
-2.64%
jan 1, 1975
279.169
-7.784
-2.71%
jan 1, 1976
271.386
-7.783
-2.79%
jan 1, 1977
263.603
-7.783
-2.87%
jan 1, 1978
255.82
-7.783
-2.95%
jan 1, 1979
249.58
-6.24
-2.44%
jan 1, 1980
243.34
-6.24
-2.5%
jan 1, 1981
237.1
-6.24
-2.56%
jan 1, 1982
230.86
-6.24
-2.63%
jan 1, 1983
224.62
-6.24
-2.7%
jan 1, 1984
220.31
-4.31
-1.92%
jan 1, 1985
215.999
-4.311
-1.96%
jan 1, 1986
211.689
-4.31
-2.0%
jan 1, 1987
207.379
-4.31
-2.04%
jan 1, 1988
203.068
-4.311
-2.08%
jan 1, 1989
198.788
-4.28
-2.11%
jan 1, 1990
194.509
-4.279
-2.15%
jan 1, 1991
190.229
-4.28
-2.2%
jan 1, 1992
185.949
-4.28
-2.25%
jan 1, 1993
181.67
-4.279
-2.3%
jan 1, 1994
179.638
-2.032
-1.12%
jan 1, 1995
177.606
-2.032
-1.13%
jan 1, 1996
175.574
-2.032
-1.14%
jan 1, 1997
173.542
-2.032
-1.16%
jan 1, 1998
171.51
-2.032
-1.17%
jan 1, 1999
170.484
-1.026
-0.6%
jan 1, 2000
169.459
-1.025
-0.6%
jan 1, 2001
168.434
-1.025
-0.6%
jan 1, 2002
167.408
-1.026
-0.61%
jan 1, 2003
166.383
-1.025
-0.61%
jan 1, 2004
165.351
-1.032
-0.62%
jan 1, 2005
164.319
-1.032
-0.62%
jan 1, 2006
163.287
-1.032
-0.63%
jan 1, 2007
162.255
-1.032
-0.63%
jan 1, 2008
161.224
-1.031
-0.64%
jan 1, 2009
164.17
+2.946
1.83%
jan 1, 2010
167.116
+2.946
1.79%
jan 1, 2011
170.062
+2.946
1.76%
jan 1, 2012
173.008
+2.946
1.73%
jan 1, 2013
175.954
+2.946
1.7%
jan 1, 2014
174.665
-1.289
-0.73%
jan 1, 2015
173.377
-1.288
-0.74%
Ranking of countries by current statistics by years


Comments: