29
/
en
AIzaSyAYiBZKx7MnpbEhh9jyipgxe19OcubqV5w
April 1, 2024
252148
St. Vincent and the Grenadines
VCT
true
2
1
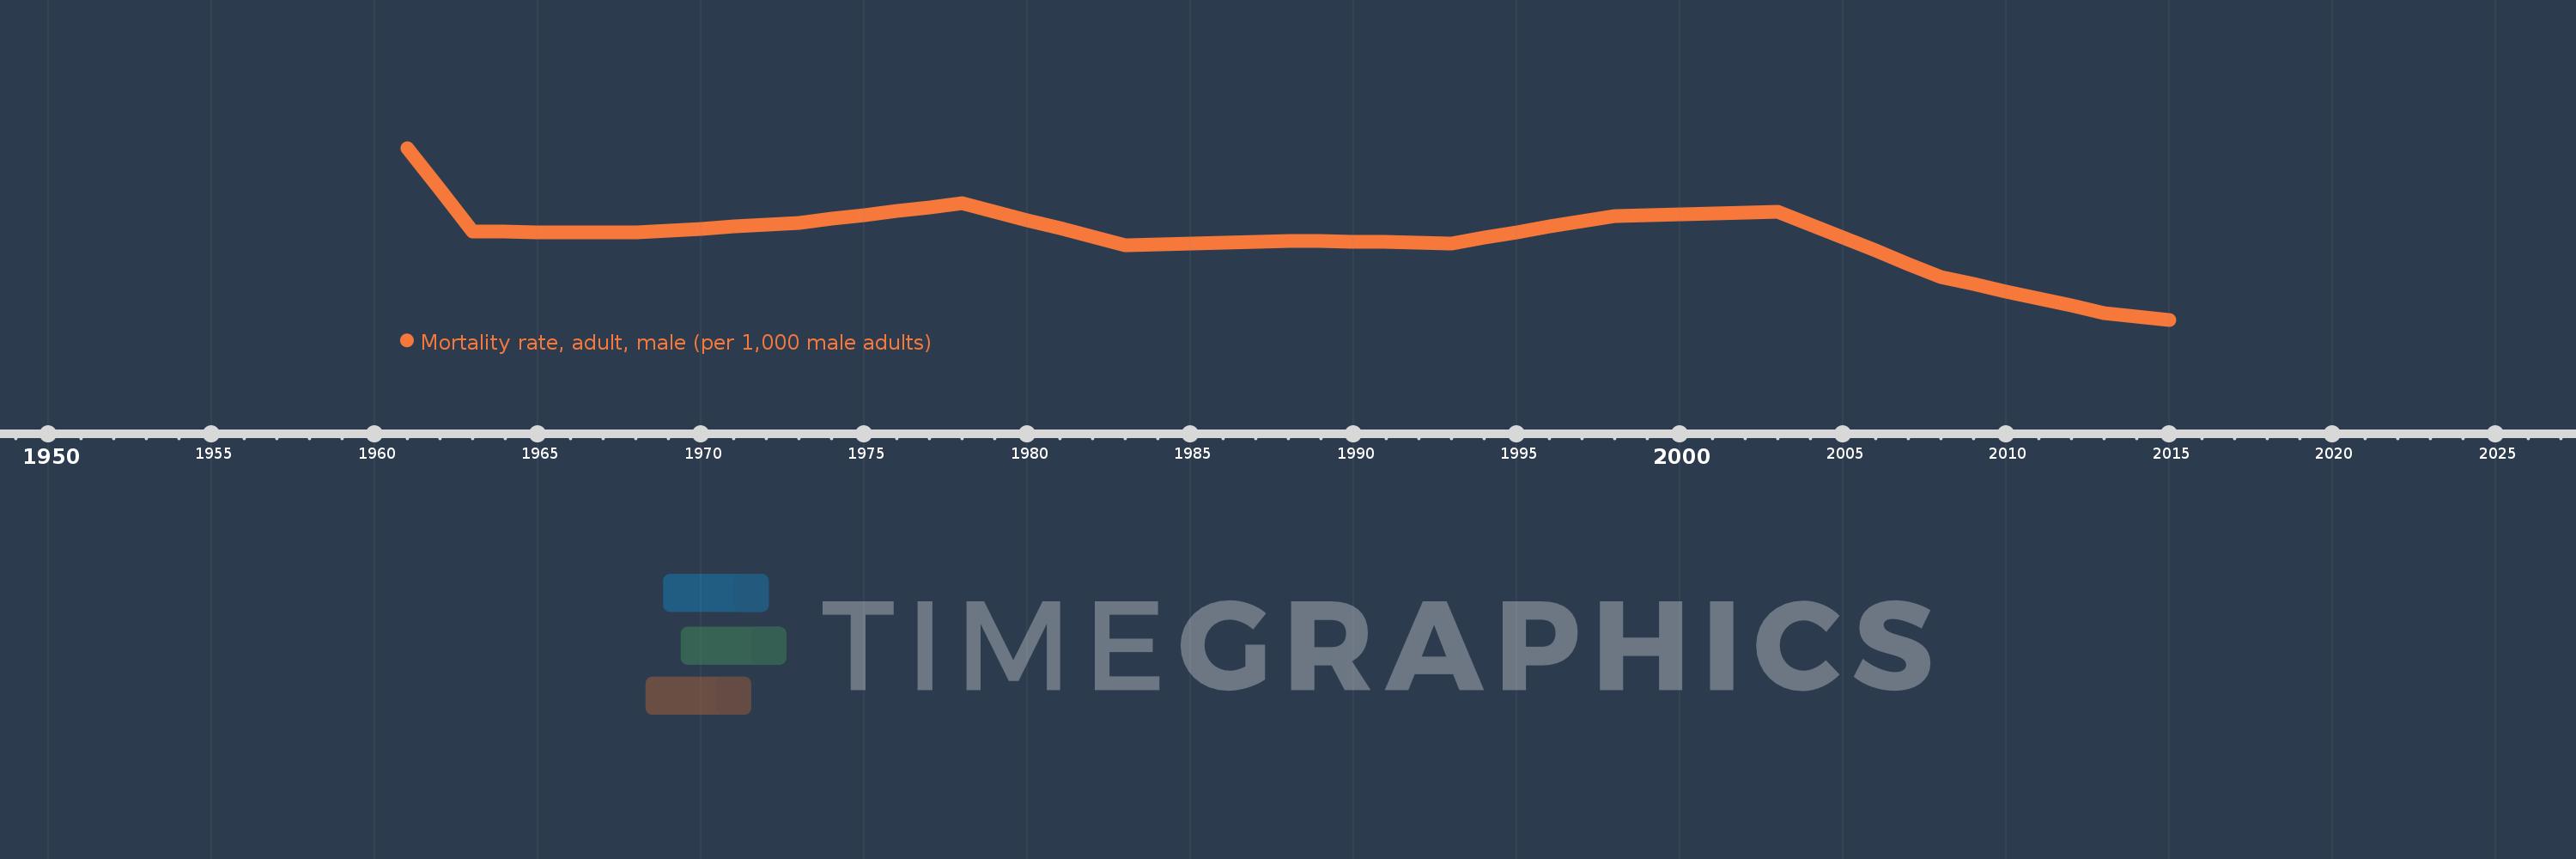
Mortality rate, adult, male (per 1,000 male adults)
2015,2014,2013,2012,2011,2010,2009,2008,2007,2006,2005,2004,2003,2002,2001,2000,1999,1998,1997,1996,1995,1994,1993,1992,1991,1990,1989,1988,1987,1986,1985,1984,1983,1982,1981,1980,1979,1978,1977,1976,1975,1974,1973,1972,1971,1970,1969,1968,1967,1966,1965,1964,1963,1962,1961
This statistics in other country:
AfghanistanAlbaniaAlgeriaAngolaAntigua and BarbudaArab WorldArgentinaArmeniaArubaAustraliaAustriaAzerbaijanBahamas, TheBahrainBangladeshBarbadosBelarusBelgiumBelizeBeninBhutanBoliviaBosnia and HerzegovinaBotswanaBrazilBrunei DarussalamBulgariaBurkina FasoBurundiCabo VerdeCambodiaCameroonCanadaCaribbean small statesCentral African RepublicCentral Europe and the BalticsChadChannel IslandsChileChinaColombiaComorosCongo, Dem. Rep.Congo, Rep.Costa RicaCote d'IvoireCroatiaCubaCuracaoCyprusCzech RepublicDenmarkDjiboutiDominicaDominican RepublicEarly-demographic dividendEast Asia & PacificEast Asia & Pacific (excluding high income)East Asia & Pacific (IDA & IBRD countries)EcuadorEgypt, Arab Rep.El SalvadorEquatorial GuineaEritreaEstoniaEthiopiaEuro areaEurope & Central AsiaEurope & Central Asia (excluding high income)Europe & Central Asia (IDA & IBRD countries)European UnionFijiFinlandFragile and conflict affected situationsFranceFrench PolynesiaGabonGambia, TheGeorgiaGermanyGhanaGreeceGreenlandGrenadaGuamGuatemalaGuineaGuinea-BissauGuyanaHaitiHeavily indebted poor countries (HIPC)High incomeHondurasHong Kong SAR, ChinaHungaryIBRD onlyIcelandIDA & IBRD totalIDA blendIDA onlyIDA totalIndiaIndonesiaIran, Islamic Rep.IraqIrelandIsraelItalyJamaicaJapanJordanKazakhstanKenyaKiribatiKorea, Dem. People’s Rep.Korea, Rep.KuwaitKyrgyz RepublicLao PDRLate-demographic dividendLatin America & Caribbean Latin America & Caribbean (excluding high income)Latin America & the Caribbean (IDA & IBRD countries)LatviaLeast developed countries: UN classificationLebanonLesothoLiberiaLibyaLithuaniaLow & middle incomeLow incomeLower middle incomeLuxembourgMacao SAR, ChinaMacedonia, FYRMadagascarMalawiMalaysiaMaldivesMaliMaltaMarshall IslandsMauritaniaMauritiusMexicoMicronesia, Fed. Sts.Middle East & North AfricaMiddle East & North Africa (excluding high income)Middle East & North Africa (IDA & IBRD countries)Middle incomeMoldovaMongoliaMontenegroMoroccoMozambiqueMyanmarNamibiaNepalNetherlandsNew CaledoniaNew ZealandNicaraguaNigerNigeriaNorth AmericaNorwayOECD membersOmanOther small statesPacific island small statesPakistanPanamaPapua New GuineaParaguayPeruPhilippinesPolandPortugalPost-demographic dividendPre-demographic dividendPuerto RicoQatarRomaniaRussian FederationRwandaSamoaSao Tome and PrincipeSaudi ArabiaSenegalSerbiaSeychellesSierra LeoneSingaporeSlovak RepublicSloveniaSmall statesSolomon IslandsSomaliaSouth AfricaSouth AsiaSouth Asia (IDA & IBRD)South SudanSpainSri LankaSt. Kitts and NevisSt. LuciaSt. Vincent and the GrenadinesSub-Saharan Africa Sub-Saharan Africa (excluding high income)Sub-Saharan Africa (IDA & IBRD countries)SudanSurinameSwazilandSwedenSwitzerlandSyrian Arab RepublicTajikistanTanzaniaThailandTimor-LesteTogoTongaTrinidad and TobagoTunisiaTurkeyTurkmenistanUgandaUkraineUnited Arab EmiratesUnited KingdomUnited StatesUpper middle incomeUruguayUzbekistanVanuatuVenezuela, RBVietnamVirgin Islands (U.S.)West Bank and GazaWorldYemen, Rep.ZambiaZimbabwe Timeline:
This timeline shows a graph from 1961 to 2015 of St. Vincent and the Grenadines. No data until 1960. Number of actual observations by date: 55.
Source name:
World Development Indicators
Source organization:
(1) United Nations Population Division. World Population Prospects. New York, United Nations, Department of Economic and Social Affairs (advanced Excel tables). Available at http://esa.un.org/wpp/unpp/panel_population.htm, (2) University of California, Berkeley, and Max Planck Institute for Demographic Research. Human Mortality Database. [ www.mortality.org or www.humanmortality.de].
Categories, topics:
Health, Gender
Last updated:
apr 23, 2017
Indicators value changes by year
Minimum:
182.383
jan 1, 2015
Maximum:
229.145
jan 1, 1961
At the date of observation
Value
Absolute change
Change from previous value
jan 1, 1961
229.145
+229.145
0.0%
jan 1, 1962
217.747
-11.398
-4.97%
jan 1, 1963
206.349
-11.398
-5.23%
jan 1, 1964
206.305
-0.044
-0.02%
jan 1, 1965
206.262
-0.043
-0.02%
jan 1, 1966
206.218
-0.044
-0.02%
jan 1, 1967
206.174
-0.044
-0.02%
jan 1, 1968
206.131
-0.043
-0.02%
jan 1, 1969
206.649
+0.518
0.25%
jan 1, 1970
207.168
+0.519
0.25%
jan 1, 1971
207.687
+0.519
0.25%
jan 1, 1972
208.205
+0.518
0.25%
jan 1, 1973
208.724
+0.519
0.25%
jan 1, 1974
209.789
+1.065
0.51%
jan 1, 1975
210.854
+1.065
0.51%
jan 1, 1976
211.92
+1.066
0.51%
jan 1, 1977
212.985
+1.065
0.5%
jan 1, 1978
214.05
+1.065
0.5%
jan 1, 1979
211.776
-2.274
-1.06%
jan 1, 1980
209.501
-2.275
-1.07%
jan 1, 1981
207.226
-2.275
-1.09%
jan 1, 1982
204.951
-2.275
-1.1%
jan 1, 1983
202.676
-2.275
-1.11%
jan 1, 1984
202.923
+0.247
0.12%
jan 1, 1985
203.169
+0.246
0.12%
jan 1, 1986
203.416
+0.247
0.12%
jan 1, 1987
203.662
+0.246
0.12%
jan 1, 1988
203.909
+0.247
0.12%
jan 1, 1989
203.771
-0.138
-0.07%
jan 1, 1990
203.633
-0.138
-0.07%
jan 1, 1991
203.494
-0.139
-0.07%
jan 1, 1992
203.356
-0.138
-0.07%
jan 1, 1993
203.218
-0.138
-0.07%
jan 1, 1994
204.713
+1.495
0.74%
jan 1, 1995
206.208
+1.495
0.73%
jan 1, 1996
207.704
+1.496
0.73%
jan 1, 1997
209.199
+1.495
0.72%
jan 1, 1998
210.694
+1.495
0.71%
jan 1, 1999
210.921
+0.227
0.11%
jan 1, 2000
211.148
+0.227
0.11%
jan 1, 2001
211.375
+0.227
0.11%
jan 1, 2002
211.602
+0.227
0.11%
jan 1, 2003
211.829
+0.227
0.11%
jan 1, 2004
208.272
-3.557
-1.68%
jan 1, 2005
204.715
-3.557
-1.71%
jan 1, 2006
201.159
-3.556
-1.74%
jan 1, 2007
197.602
-3.557
-1.77%
jan 1, 2008
194.045
-3.557
-1.8%
jan 1, 2009
192.092
-1.953
-1.01%
jan 1, 2010
190.139
-1.953
-1.02%
jan 1, 2011
188.185
-1.954
-1.03%
jan 1, 2012
186.232
-1.953
-1.04%
jan 1, 2013
184.279
-1.953
-1.05%
jan 1, 2014
183.331
-0.948
-0.51%
jan 1, 2015
182.383
-0.948
-0.52%
Ranking of countries by current statistics by years


Comments: