29
/
en
AIzaSyAYiBZKx7MnpbEhh9jyipgxe19OcubqV5w
April 1, 2024
113898
Cote d'Ivoire
CIV
true
2
1
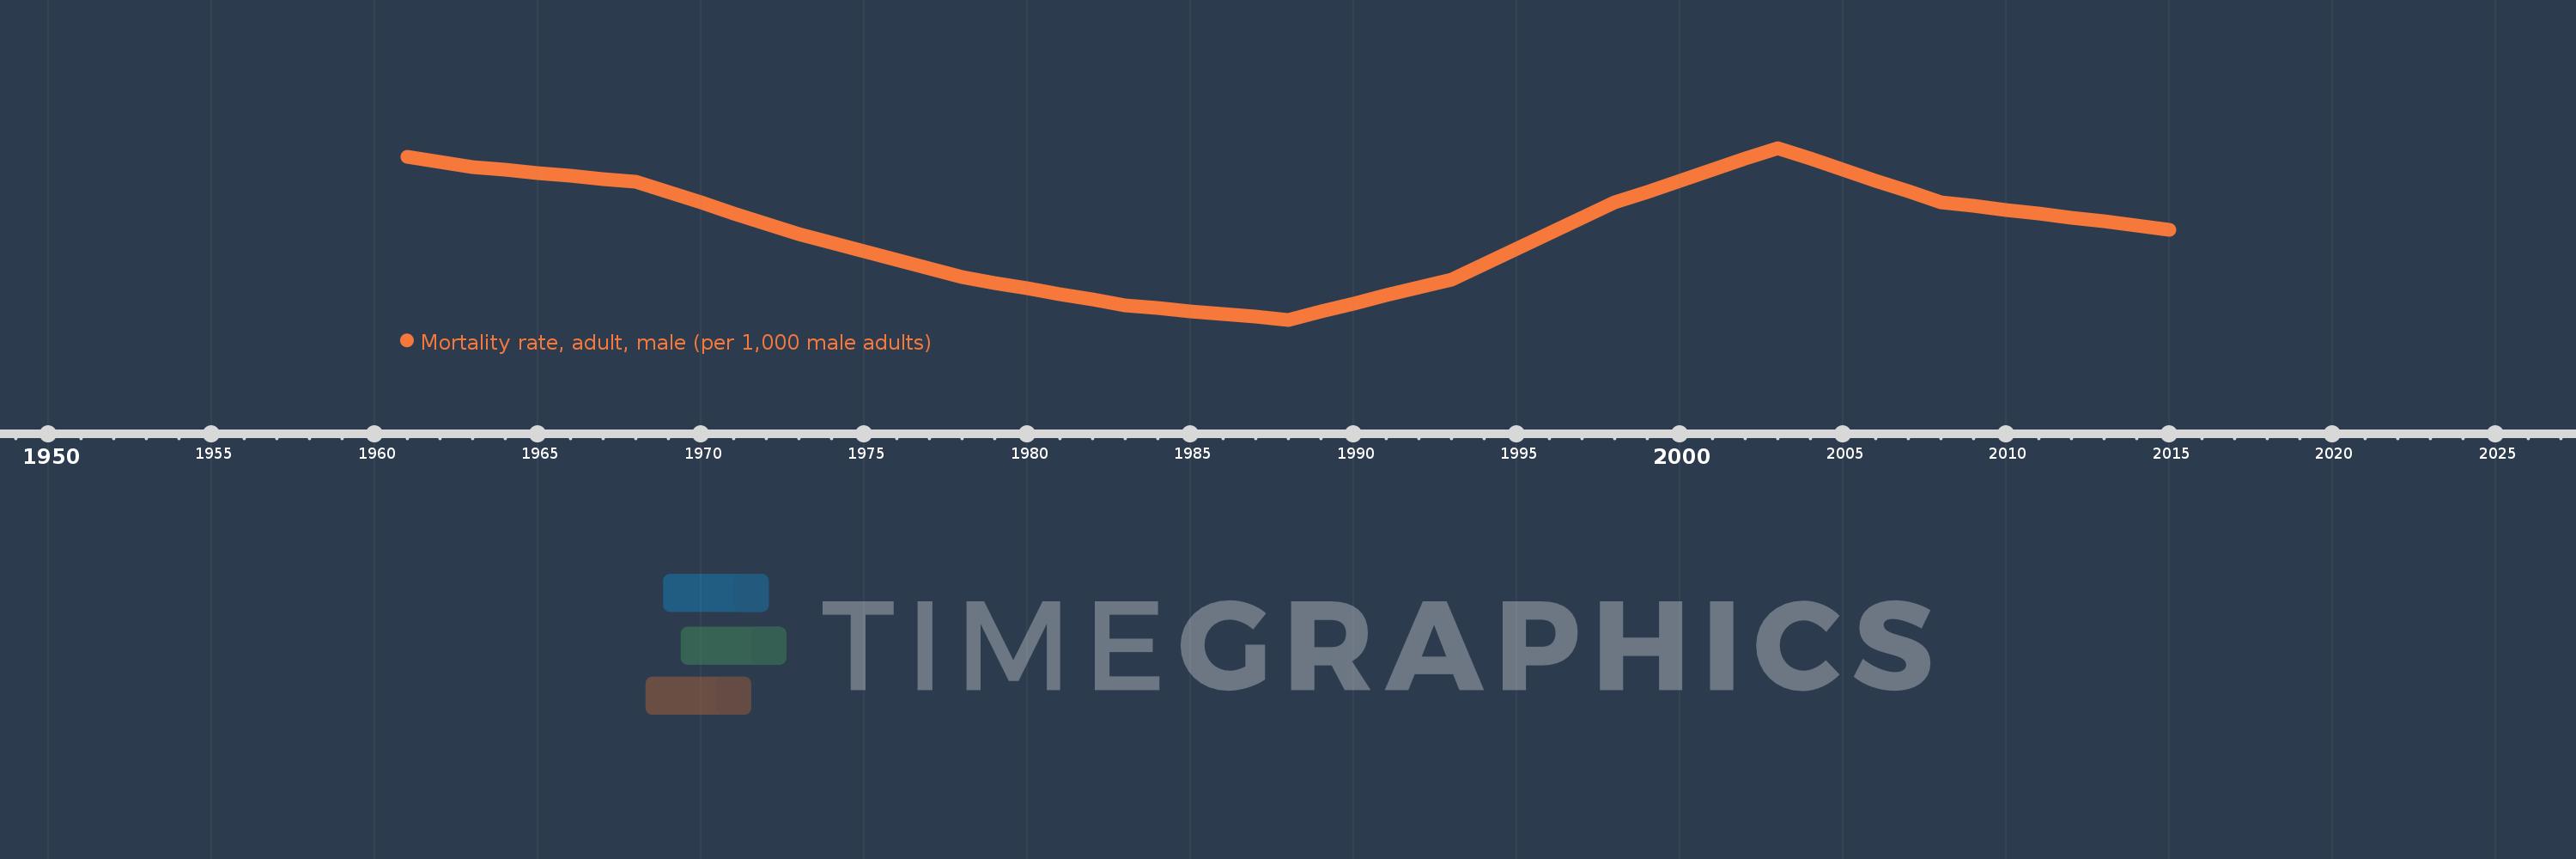
Mortality rate, adult, male (per 1,000 male adults)
2015,2014,2013,2012,2011,2010,2009,2008,2007,2006,2005,2004,2003,2002,2001,2000,1999,1998,1997,1996,1995,1994,1993,1992,1991,1990,1989,1988,1987,1986,1985,1984,1983,1982,1981,1980,1979,1978,1977,1976,1975,1974,1973,1972,1971,1970,1969,1968,1967,1966,1965,1964,1963,1962,1961
This statistics in other country:
AfghanistanAlbaniaAlgeriaAngolaAntigua and BarbudaArab WorldArgentinaArmeniaArubaAustraliaAustriaAzerbaijanBahamas, TheBahrainBangladeshBarbadosBelarusBelgiumBelizeBeninBhutanBoliviaBosnia and HerzegovinaBotswanaBrazilBrunei DarussalamBulgariaBurkina FasoBurundiCabo VerdeCambodiaCameroonCanadaCaribbean small statesCentral African RepublicCentral Europe and the BalticsChadChannel IslandsChileChinaColombiaComorosCongo, Dem. Rep.Congo, Rep.Costa RicaCote d'IvoireCroatiaCubaCuracaoCyprusCzech RepublicDenmarkDjiboutiDominicaDominican RepublicEarly-demographic dividendEast Asia & PacificEast Asia & Pacific (excluding high income)East Asia & Pacific (IDA & IBRD countries)EcuadorEgypt, Arab Rep.El SalvadorEquatorial GuineaEritreaEstoniaEthiopiaEuro areaEurope & Central AsiaEurope & Central Asia (excluding high income)Europe & Central Asia (IDA & IBRD countries)European UnionFijiFinlandFragile and conflict affected situationsFranceFrench PolynesiaGabonGambia, TheGeorgiaGermanyGhanaGreeceGreenlandGrenadaGuamGuatemalaGuineaGuinea-BissauGuyanaHaitiHeavily indebted poor countries (HIPC)High incomeHondurasHong Kong SAR, ChinaHungaryIBRD onlyIcelandIDA & IBRD totalIDA blendIDA onlyIDA totalIndiaIndonesiaIran, Islamic Rep.IraqIrelandIsraelItalyJamaicaJapanJordanKazakhstanKenyaKiribatiKorea, Dem. People’s Rep.Korea, Rep.KuwaitKyrgyz RepublicLao PDRLate-demographic dividendLatin America & Caribbean Latin America & Caribbean (excluding high income)Latin America & the Caribbean (IDA & IBRD countries)LatviaLeast developed countries: UN classificationLebanonLesothoLiberiaLibyaLithuaniaLow & middle incomeLow incomeLower middle incomeLuxembourgMacao SAR, ChinaMacedonia, FYRMadagascarMalawiMalaysiaMaldivesMaliMaltaMarshall IslandsMauritaniaMauritiusMexicoMicronesia, Fed. Sts.Middle East & North AfricaMiddle East & North Africa (excluding high income)Middle East & North Africa (IDA & IBRD countries)Middle incomeMoldovaMongoliaMontenegroMoroccoMozambiqueMyanmarNamibiaNepalNetherlandsNew CaledoniaNew ZealandNicaraguaNigerNigeriaNorth AmericaNorwayOECD membersOmanOther small statesPacific island small statesPakistanPanamaPapua New GuineaParaguayPeruPhilippinesPolandPortugalPost-demographic dividendPre-demographic dividendPuerto RicoQatarRomaniaRussian FederationRwandaSamoaSao Tome and PrincipeSaudi ArabiaSenegalSerbiaSeychellesSierra LeoneSingaporeSlovak RepublicSloveniaSmall statesSolomon IslandsSomaliaSouth AfricaSouth AsiaSouth Asia (IDA & IBRD)South SudanSpainSri LankaSt. Kitts and NevisSt. LuciaSt. Vincent and the GrenadinesSub-Saharan Africa Sub-Saharan Africa (excluding high income)Sub-Saharan Africa (IDA & IBRD countries)SudanSurinameSwazilandSwedenSwitzerlandSyrian Arab RepublicTajikistanTanzaniaThailandTimor-LesteTogoTongaTrinidad and TobagoTunisiaTurkeyTurkmenistanUgandaUkraineUnited Arab EmiratesUnited KingdomUnited StatesUpper middle incomeUruguayUzbekistanVanuatuVenezuela, RBVietnamVirgin Islands (U.S.)West Bank and GazaWorldYemen, Rep.ZambiaZimbabwe Timeline:
This timeline shows a graph from 1961 to 2015 of Cote d'Ivoire. No data until 1960. Number of actual observations by date: 55.
Source name:
World Development Indicators
Source organization:
(1) United Nations Population Division. World Population Prospects. New York, United Nations, Department of Economic and Social Affairs (advanced Excel tables). Available at http://esa.un.org/wpp/unpp/panel_population.htm, (2) University of California, Berkeley, and Max Planck Institute for Demographic Research. Human Mortality Database. [ www.mortality.org or www.humanmortality.de].
Categories, topics:
Health, Gender
Last updated:
apr 23, 2017
Indicators value changes by year
Minimum:
353.907
jan 1, 1988
Maximum:
487.662
jan 1, 2003
At the date of observation
Value
Absolute change
Change from previous value
jan 1, 1961
480.763
+480.763
0.0%
jan 1, 1962
476.879
-3.884
-0.81%
jan 1, 1963
472.996
-3.883
-0.81%
jan 1, 1964
470.643
-2.353
-0.5%
jan 1, 1965
468.29
-2.353
-0.5%
jan 1, 1966
465.937
-2.353
-0.5%
jan 1, 1967
463.584
-2.353
-0.51%
jan 1, 1968
461.231
-2.353
-0.51%
jan 1, 1969
453.135
-8.096
-1.76%
jan 1, 1970
445.039
-8.096
-1.79%
jan 1, 1971
436.942
-8.097
-1.82%
jan 1, 1972
428.846
-8.096
-1.85%
jan 1, 1973
420.75
-8.096
-1.89%
jan 1, 1974
414.033
-6.717
-1.6%
jan 1, 1975
407.316
-6.717
-1.62%
jan 1, 1976
400.6
-6.716
-1.65%
jan 1, 1977
393.883
-6.717
-1.68%
jan 1, 1978
387.166
-6.717
-1.71%
jan 1, 1979
382.785
-4.381
-1.13%
jan 1, 1980
378.404
-4.381
-1.14%
jan 1, 1981
374.023
-4.381
-1.16%
jan 1, 1982
369.642
-4.381
-1.17%
jan 1, 1983
365.261
-4.381
-1.19%
jan 1, 1984
362.99
-2.271
-0.62%
jan 1, 1985
360.719
-2.271
-0.63%
jan 1, 1986
358.448
-2.271
-0.63%
jan 1, 1987
356.178
-2.27
-0.63%
jan 1, 1988
353.907
-2.271
-0.64%
jan 1, 1989
360.203
+6.296
1.78%
jan 1, 1990
366.498
+6.295
1.75%
jan 1, 1991
372.794
+6.296
1.72%
jan 1, 1992
379.09
+6.296
1.69%
jan 1, 1993
385.386
+6.296
1.66%
jan 1, 1994
397.332
+11.946
3.1%
jan 1, 1995
409.279
+11.947
3.01%
jan 1, 1996
421.225
+11.946
2.92%
jan 1, 1997
433.172
+11.947
2.84%
jan 1, 1998
445.118
+11.946
2.76%
jan 1, 1999
453.627
+8.509
1.91%
jan 1, 2000
462.136
+8.509
1.88%
jan 1, 2001
470.644
+8.508
1.84%
jan 1, 2002
479.153
+8.509
1.81%
jan 1, 2003
487.662
+8.509
1.78%
jan 1, 2004
479.219
-8.443
-1.73%
jan 1, 2005
470.776
-8.443
-1.76%
jan 1, 2006
462.333
-8.443
-1.79%
jan 1, 2007
453.89
-8.443
-1.83%
jan 1, 2008
445.448
-8.442
-1.86%
jan 1, 2009
442.439
-3.009
-0.68%
jan 1, 2010
439.431
-3.008
-0.68%
jan 1, 2011
436.423
-3.008
-0.68%
jan 1, 2012
433.415
-3.008
-0.69%
jan 1, 2013
430.407
-3.008
-0.69%
jan 1, 2014
427.127
-3.28
-0.76%
jan 1, 2015
423.848
-3.279
-0.77%
Ranking of countries by current statistics by years


Comments: