29
/
en
AIzaSyAYiBZKx7MnpbEhh9jyipgxe19OcubqV5w
April 1, 2024
31853
Europe & Central Asia (excluding high income)
ECA
false
2
1
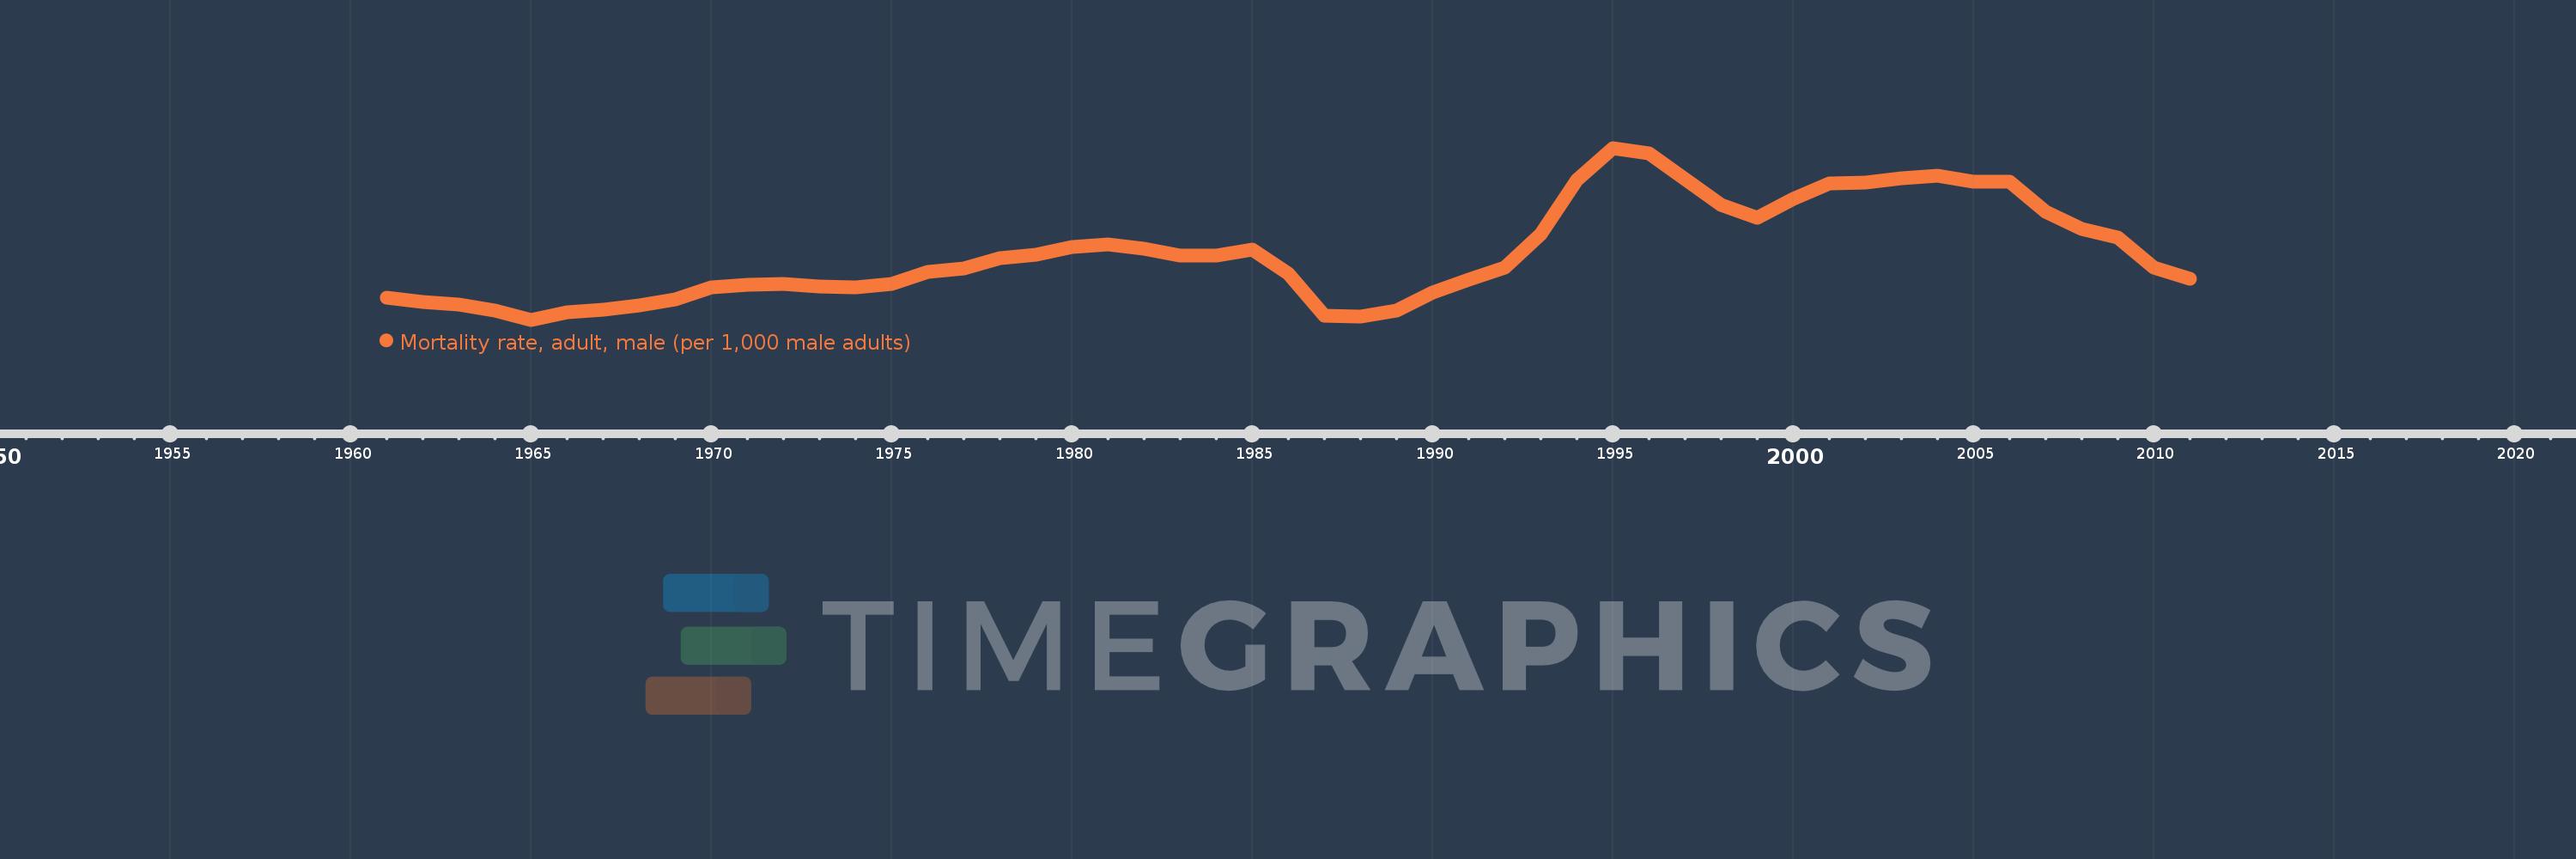
Mortality rate, adult, male (per 1,000 male adults)
2011,2010,2009,2008,2007,2006,2005,2004,2003,2002,2001,2000,1999,1998,1997,1996,1995,1994,1993,1992,1991,1990,1989,1988,1987,1986,1985,1984,1983,1982,1981,1980,1979,1978,1977,1976,1975,1974,1973,1972,1971,1970,1969,1968,1967,1966,1965,1964,1963,1962,1961
This statistics in other country:
AfghanistanAlbaniaAlgeriaAngolaAntigua and BarbudaArab WorldArgentinaArmeniaArubaAustraliaAustriaAzerbaijanBahamas, TheBahrainBangladeshBarbadosBelarusBelgiumBelizeBeninBhutanBoliviaBosnia and HerzegovinaBotswanaBrazilBrunei DarussalamBulgariaBurkina FasoBurundiCabo VerdeCambodiaCameroonCanadaCaribbean small statesCentral African RepublicCentral Europe and the BalticsChadChannel IslandsChileChinaColombiaComorosCongo, Dem. Rep.Congo, Rep.Costa RicaCote d'IvoireCroatiaCubaCuracaoCyprusCzech RepublicDenmarkDjiboutiDominicaDominican RepublicEarly-demographic dividendEast Asia & PacificEast Asia & Pacific (excluding high income)East Asia & Pacific (IDA & IBRD countries)EcuadorEgypt, Arab Rep.El SalvadorEquatorial GuineaEritreaEstoniaEthiopiaEuro areaEurope & Central AsiaEurope & Central Asia (excluding high income)Europe & Central Asia (IDA & IBRD countries)European UnionFijiFinlandFragile and conflict affected situationsFranceFrench PolynesiaGabonGambia, TheGeorgiaGermanyGhanaGreeceGreenlandGrenadaGuamGuatemalaGuineaGuinea-BissauGuyanaHaitiHeavily indebted poor countries (HIPC)High incomeHondurasHong Kong SAR, ChinaHungaryIBRD onlyIcelandIDA & IBRD totalIDA blendIDA onlyIDA totalIndiaIndonesiaIran, Islamic Rep.IraqIrelandIsraelItalyJamaicaJapanJordanKazakhstanKenyaKiribatiKorea, Dem. People’s Rep.Korea, Rep.KuwaitKyrgyz RepublicLao PDRLate-demographic dividendLatin America & Caribbean Latin America & Caribbean (excluding high income)Latin America & the Caribbean (IDA & IBRD countries)LatviaLeast developed countries: UN classificationLebanonLesothoLiberiaLibyaLithuaniaLow & middle incomeLow incomeLower middle incomeLuxembourgMacao SAR, ChinaMacedonia, FYRMadagascarMalawiMalaysiaMaldivesMaliMaltaMarshall IslandsMauritaniaMauritiusMexicoMicronesia, Fed. Sts.Middle East & North AfricaMiddle East & North Africa (excluding high income)Middle East & North Africa (IDA & IBRD countries)Middle incomeMoldovaMongoliaMontenegroMoroccoMozambiqueMyanmarNamibiaNepalNetherlandsNew CaledoniaNew ZealandNicaraguaNigerNigeriaNorth AmericaNorwayOECD membersOmanOther small statesPacific island small statesPakistanPanamaPapua New GuineaParaguayPeruPhilippinesPolandPortugalPost-demographic dividendPre-demographic dividendPuerto RicoQatarRomaniaRussian FederationRwandaSamoaSao Tome and PrincipeSaudi ArabiaSenegalSerbiaSeychellesSierra LeoneSingaporeSlovak RepublicSloveniaSmall statesSolomon IslandsSomaliaSouth AfricaSouth AsiaSouth Asia (IDA & IBRD)South SudanSpainSri LankaSt. Kitts and NevisSt. LuciaSt. Vincent and the GrenadinesSub-Saharan Africa Sub-Saharan Africa (excluding high income)Sub-Saharan Africa (IDA & IBRD countries)SudanSurinameSwazilandSwedenSwitzerlandSyrian Arab RepublicTajikistanTanzaniaThailandTimor-LesteTogoTongaTrinidad and TobagoTunisiaTurkeyTurkmenistanUgandaUkraineUnited Arab EmiratesUnited KingdomUnited StatesUpper middle incomeUruguayUzbekistanVanuatuVenezuela, RBVietnamVirgin Islands (U.S.)West Bank and GazaWorldYemen, Rep.ZambiaZimbabwe Timeline:
This timeline shows a graph from 1961 to 2011 of Europe & Central Asia (excluding high income). No data until 1960. Number of actual observations by date: 51.
Source name:
World Development Indicators
Source organization:
(1) United Nations Population Division. World Population Prospects. New York, United Nations, Department of Economic and Social Affairs (advanced Excel tables). Available at http://esa.un.org/wpp/unpp/panel_population.htm, (2) University of California, Berkeley, and Max Planck Institute for Demographic Research. Human Mortality Database. [ www.mortality.org or www.humanmortality.de].
Categories, topics:
Health, Gender
Last updated:
apr 23, 2017
Indicators value changes by year
Minimum:
252.167
jan 1, 1965
Maximum:
360.027
jan 1, 1995
At the date of observation
Value
Absolute change
Change from previous value
jan 1, 1961
266.14
+266.14
0.0%
jan 1, 1962
263.445
-2.695
-1.01%
jan 1, 1963
261.797
-1.648
-0.63%
jan 1, 1964
258.184
-3.612
-1.38%
jan 1, 1965
252.167
-6.018
-2.33%
jan 1, 1966
257.008
+4.841
1.92%
jan 1, 1967
258.221
+1.213
0.47%
jan 1, 1968
261.336
+3.116
1.21%
jan 1, 1969
265.071
+3.735
1.43%
jan 1, 1970
272.649
+7.578
2.86%
jan 1, 1971
274.157
+1.508
0.55%
jan 1, 1972
274.599
+0.442
0.16%
jan 1, 1973
272.773
-1.826
-0.66%
jan 1, 1974
272.345
-0.428
-0.16%
jan 1, 1975
274.77
+2.424
0.89%
jan 1, 1976
282.464
+7.695
2.8%
jan 1, 1977
284.567
+2.102
0.74%
jan 1, 1978
290.658
+6.091
2.14%
jan 1, 1979
293.05
+2.392
0.82%
jan 1, 1980
297.71
+4.66
1.59%
jan 1, 1981
299.492
+1.782
0.6%
jan 1, 1982
296.702
-2.791
-0.93%
jan 1, 1983
292.379
-4.322
-1.46%
jan 1, 1984
292.274
-0.105
-0.04%
jan 1, 1985
296.444
+4.17
1.43%
jan 1, 1986
281.021
-15.423
-5.2%
jan 1, 1987
254.562
-26.459
-9.42%
jan 1, 1988
254.408
-0.154
-0.06%
jan 1, 1989
257.944
+3.536
1.39%
jan 1, 1990
269.065
+11.121
4.31%
jan 1, 1991
277.579
+8.514
3.16%
jan 1, 1992
284.737
+7.158
2.58%
jan 1, 1993
306.094
+21.357
7.5%
jan 1, 1994
339.875
+33.781
11.04%
jan 1, 1995
360.027
+20.152
5.93%
jan 1, 1996
356.759
-3.269
-0.91%
jan 1, 1997
340.353
-16.406
-4.6%
jan 1, 1998
324.199
-16.154
-4.75%
jan 1, 1999
316.044
-8.155
-2.52%
jan 1, 2000
328.175
+12.131
3.84%
jan 1, 2001
337.534
+9.359
2.85%
jan 1, 2002
338.464
+0.93
0.28%
jan 1, 2003
341.211
+2.747
0.81%
jan 1, 2004
342.49
+1.279
0.37%
jan 1, 2005
338.922
-3.568
-1.04%
jan 1, 2006
338.988
+0.066
0.02%
jan 1, 2007
320.174
-18.814
-5.55%
jan 1, 2008
308.959
-11.215
-3.5%
jan 1, 2009
303.632
-5.326
-1.72%
jan 1, 2010
285.131
-18.501
-6.09%
jan 1, 2011
277.984
-7.148
-2.51%
Ranking of countries by current statistics by years


Comments: