29
/
en
AIzaSyAYiBZKx7MnpbEhh9jyipgxe19OcubqV5w
April 1, 2024
264906
Togo
TGO
true
2
1
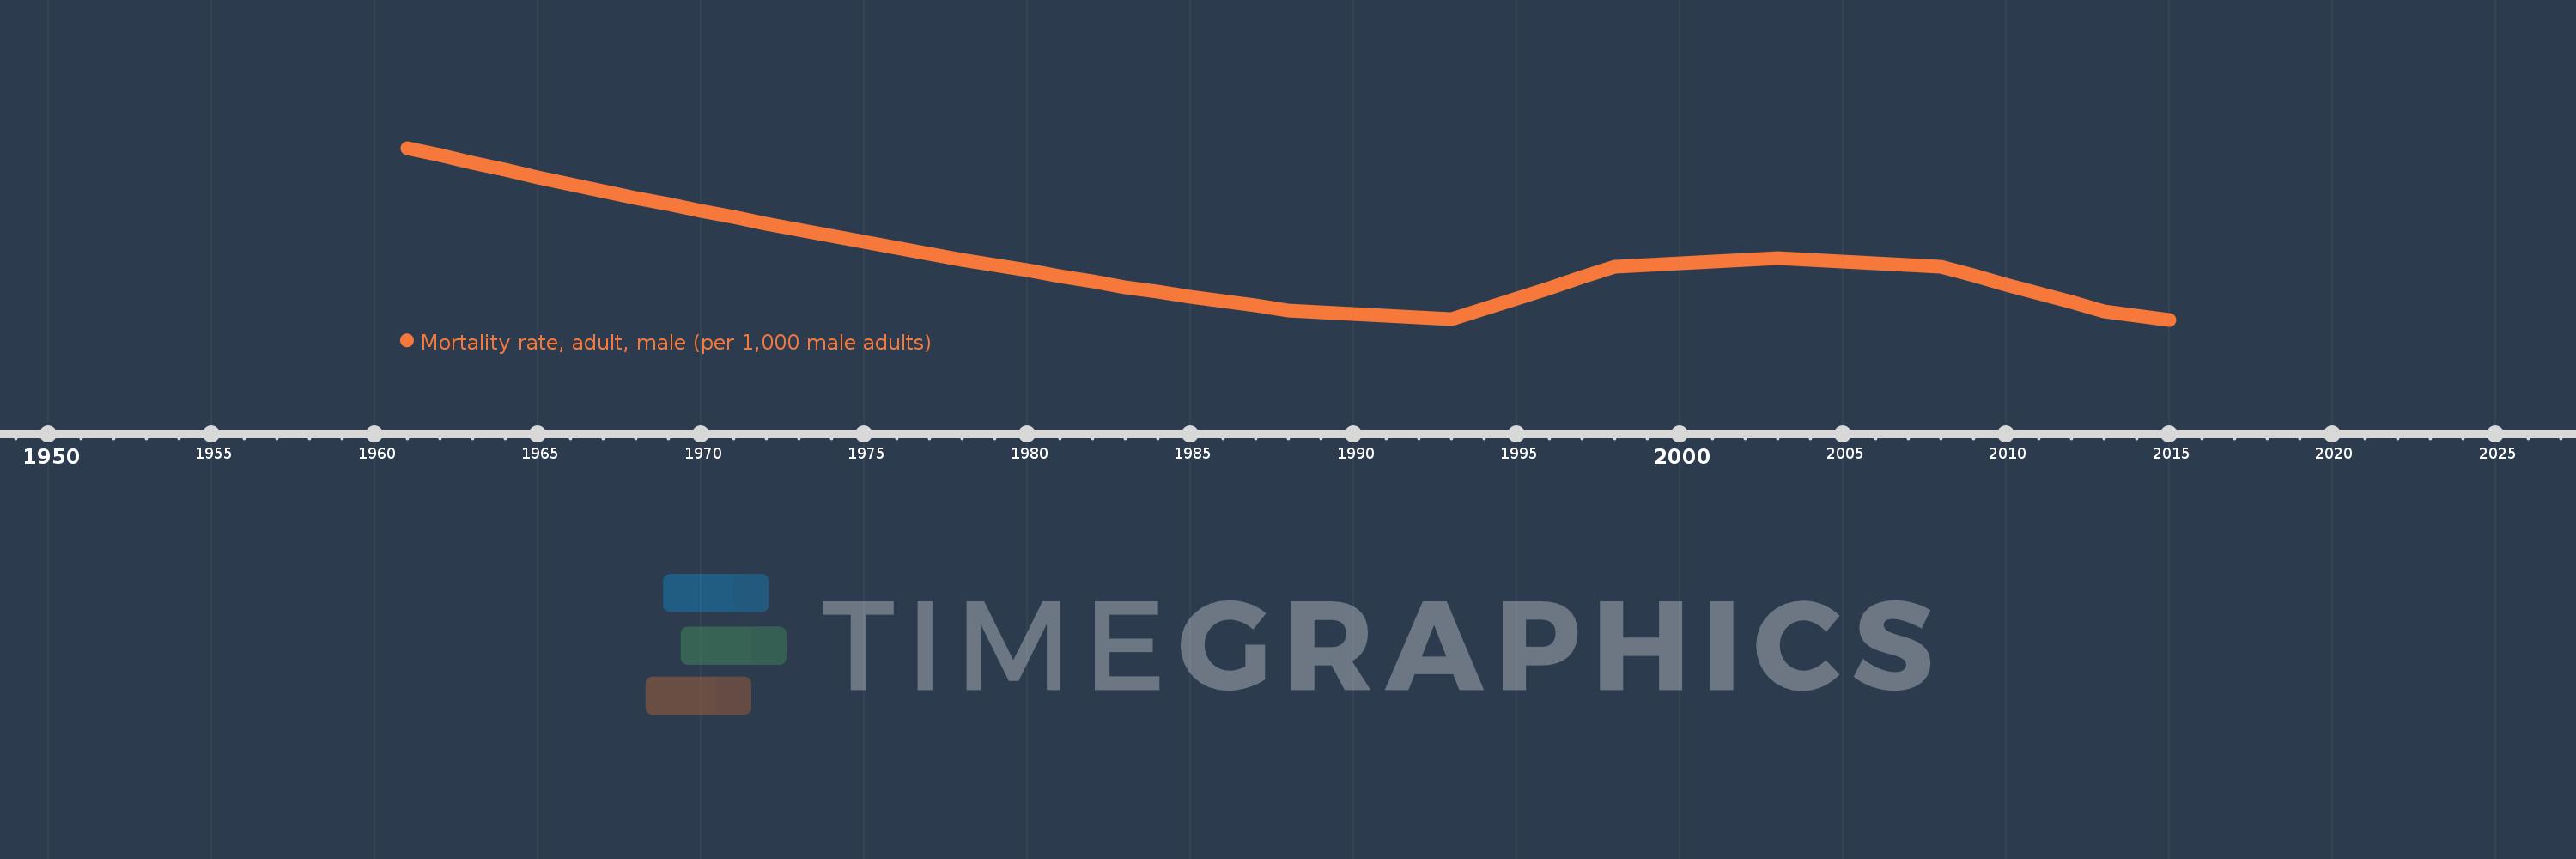
Mortality rate, adult, male (per 1,000 male adults)
2015,2014,2013,2012,2011,2010,2009,2008,2007,2006,2005,2004,2003,2002,2001,2000,1999,1998,1997,1996,1995,1994,1993,1992,1991,1990,1989,1988,1987,1986,1985,1984,1983,1982,1981,1980,1979,1978,1977,1976,1975,1974,1973,1972,1971,1970,1969,1968,1967,1966,1965,1964,1963,1962,1961
This statistics in other country:
AfghanistanAlbaniaAlgeriaAngolaAntigua and BarbudaArab WorldArgentinaArmeniaArubaAustraliaAustriaAzerbaijanBahamas, TheBahrainBangladeshBarbadosBelarusBelgiumBelizeBeninBhutanBoliviaBosnia and HerzegovinaBotswanaBrazilBrunei DarussalamBulgariaBurkina FasoBurundiCabo VerdeCambodiaCameroonCanadaCaribbean small statesCentral African RepublicCentral Europe and the BalticsChadChannel IslandsChileChinaColombiaComorosCongo, Dem. Rep.Congo, Rep.Costa RicaCote d'IvoireCroatiaCubaCuracaoCyprusCzech RepublicDenmarkDjiboutiDominicaDominican RepublicEarly-demographic dividendEast Asia & PacificEast Asia & Pacific (excluding high income)East Asia & Pacific (IDA & IBRD countries)EcuadorEgypt, Arab Rep.El SalvadorEquatorial GuineaEritreaEstoniaEthiopiaEuro areaEurope & Central AsiaEurope & Central Asia (excluding high income)Europe & Central Asia (IDA & IBRD countries)European UnionFijiFinlandFragile and conflict affected situationsFranceFrench PolynesiaGabonGambia, TheGeorgiaGermanyGhanaGreeceGreenlandGrenadaGuamGuatemalaGuineaGuinea-BissauGuyanaHaitiHeavily indebted poor countries (HIPC)High incomeHondurasHong Kong SAR, ChinaHungaryIBRD onlyIcelandIDA & IBRD totalIDA blendIDA onlyIDA totalIndiaIndonesiaIran, Islamic Rep.IraqIrelandIsraelItalyJamaicaJapanJordanKazakhstanKenyaKiribatiKorea, Dem. People’s Rep.Korea, Rep.KuwaitKyrgyz RepublicLao PDRLate-demographic dividendLatin America & Caribbean Latin America & Caribbean (excluding high income)Latin America & the Caribbean (IDA & IBRD countries)LatviaLeast developed countries: UN classificationLebanonLesothoLiberiaLibyaLithuaniaLow & middle incomeLow incomeLower middle incomeLuxembourgMacao SAR, ChinaMacedonia, FYRMadagascarMalawiMalaysiaMaldivesMaliMaltaMarshall IslandsMauritaniaMauritiusMexicoMicronesia, Fed. Sts.Middle East & North AfricaMiddle East & North Africa (excluding high income)Middle East & North Africa (IDA & IBRD countries)Middle incomeMoldovaMongoliaMontenegroMoroccoMozambiqueMyanmarNamibiaNepalNetherlandsNew CaledoniaNew ZealandNicaraguaNigerNigeriaNorth AmericaNorwayOECD membersOmanOther small statesPacific island small statesPakistanPanamaPapua New GuineaParaguayPeruPhilippinesPolandPortugalPost-demographic dividendPre-demographic dividendPuerto RicoQatarRomaniaRussian FederationRwandaSamoaSao Tome and PrincipeSaudi ArabiaSenegalSerbiaSeychellesSierra LeoneSingaporeSlovak RepublicSloveniaSmall statesSolomon IslandsSomaliaSouth AfricaSouth AsiaSouth Asia (IDA & IBRD)South SudanSpainSri LankaSt. Kitts and NevisSt. LuciaSt. Vincent and the GrenadinesSub-Saharan Africa Sub-Saharan Africa (excluding high income)Sub-Saharan Africa (IDA & IBRD countries)SudanSurinameSwazilandSwedenSwitzerlandSyrian Arab RepublicTajikistanTanzaniaThailandTimor-LesteTogoTongaTrinidad and TobagoTunisiaTurkeyTurkmenistanUgandaUkraineUnited Arab EmiratesUnited KingdomUnited StatesUpper middle incomeUruguayUzbekistanVanuatuVenezuela, RBVietnamVirgin Islands (U.S.)West Bank and GazaWorldYemen, Rep.ZambiaZimbabwe Timeline:
This timeline shows a graph from 1961 to 2015 of Togo. No data until 1960. Number of actual observations by date: 55.
Source name:
World Development Indicators
Source organization:
(1) United Nations Population Division. World Population Prospects. New York, United Nations, Department of Economic and Social Affairs (advanced Excel tables). Available at http://esa.un.org/wpp/unpp/panel_population.htm, (2) University of California, Berkeley, and Max Planck Institute for Demographic Research. Human Mortality Database. [ www.mortality.org or www.humanmortality.de].
Categories, topics:
Health, Gender
Last updated:
apr 23, 2017
Indicators value changes by year
Minimum:
289.03
jan 1, 2015
Maximum:
468.151
jan 1, 1961
At the date of observation
Value
Absolute change
Change from previous value
jan 1, 1961
468.151
+468.151
0.0%
jan 1, 1962
460.285
-7.866
-1.68%
jan 1, 1963
452.418
-7.867
-1.71%
jan 1, 1964
445.136
-7.282
-1.61%
jan 1, 1965
437.854
-7.282
-1.64%
jan 1, 1966
430.572
-7.282
-1.66%
jan 1, 1967
423.29
-7.282
-1.69%
jan 1, 1968
416.008
-7.282
-1.72%
jan 1, 1969
409.296
-6.712
-1.61%
jan 1, 1970
402.583
-6.713
-1.64%
jan 1, 1971
395.871
-6.712
-1.67%
jan 1, 1972
389.158
-6.713
-1.7%
jan 1, 1973
382.446
-6.712
-1.72%
jan 1, 1974
376.333
-6.113
-1.6%
jan 1, 1975
370.22
-6.113
-1.62%
jan 1, 1976
364.107
-6.113
-1.65%
jan 1, 1977
357.994
-6.113
-1.68%
jan 1, 1978
351.882
-6.112
-1.71%
jan 1, 1979
346.084
-5.798
-1.65%
jan 1, 1980
340.286
-5.798
-1.68%
jan 1, 1981
334.489
-5.797
-1.7%
jan 1, 1982
328.691
-5.798
-1.73%
jan 1, 1983
322.893
-5.798
-1.76%
jan 1, 1984
318.1
-4.793
-1.48%
jan 1, 1985
313.307
-4.793
-1.51%
jan 1, 1986
308.513
-4.794
-1.53%
jan 1, 1987
303.72
-4.793
-1.55%
jan 1, 1988
298.926
-4.794
-1.58%
jan 1, 1989
297.018
-1.908
-0.64%
jan 1, 1990
295.11
-1.908
-0.64%
jan 1, 1991
293.202
-1.908
-0.65%
jan 1, 1992
291.294
-1.908
-0.65%
jan 1, 1993
289.386
-1.908
-0.66%
jan 1, 1994
300.353
+10.967
3.79%
jan 1, 1995
311.32
+10.967
3.65%
jan 1, 1996
322.286
+10.966
3.52%
jan 1, 1997
333.253
+10.967
3.4%
jan 1, 1998
344.219
+10.966
3.29%
jan 1, 1999
345.969
+1.75
0.51%
jan 1, 2000
347.719
+1.75
0.51%
jan 1, 2001
349.469
+1.75
0.5%
jan 1, 2002
351.219
+1.75
0.5%
jan 1, 2003
352.969
+1.75
0.5%
jan 1, 2004
351.252
-1.717
-0.49%
jan 1, 2005
349.535
-1.717
-0.49%
jan 1, 2006
347.818
-1.717
-0.49%
jan 1, 2007
346.101
-1.717
-0.49%
jan 1, 2008
344.384
-1.717
-0.5%
jan 1, 2009
335.123
-9.261
-2.69%
jan 1, 2010
325.861
-9.262
-2.76%
jan 1, 2011
316.599
-9.262
-2.84%
jan 1, 2012
307.337
-9.262
-2.93%
jan 1, 2013
298.075
-9.262
-3.01%
jan 1, 2014
293.553
-4.522
-1.52%
jan 1, 2015
289.03
-4.523
-1.54%
Ranking of countries by current statistics by years


Comments: