29
/
en
AIzaSyAYiBZKx7MnpbEhh9jyipgxe19OcubqV5w
April 1, 2024
109968
Congo, Dem. Rep.
COD
true
2
1
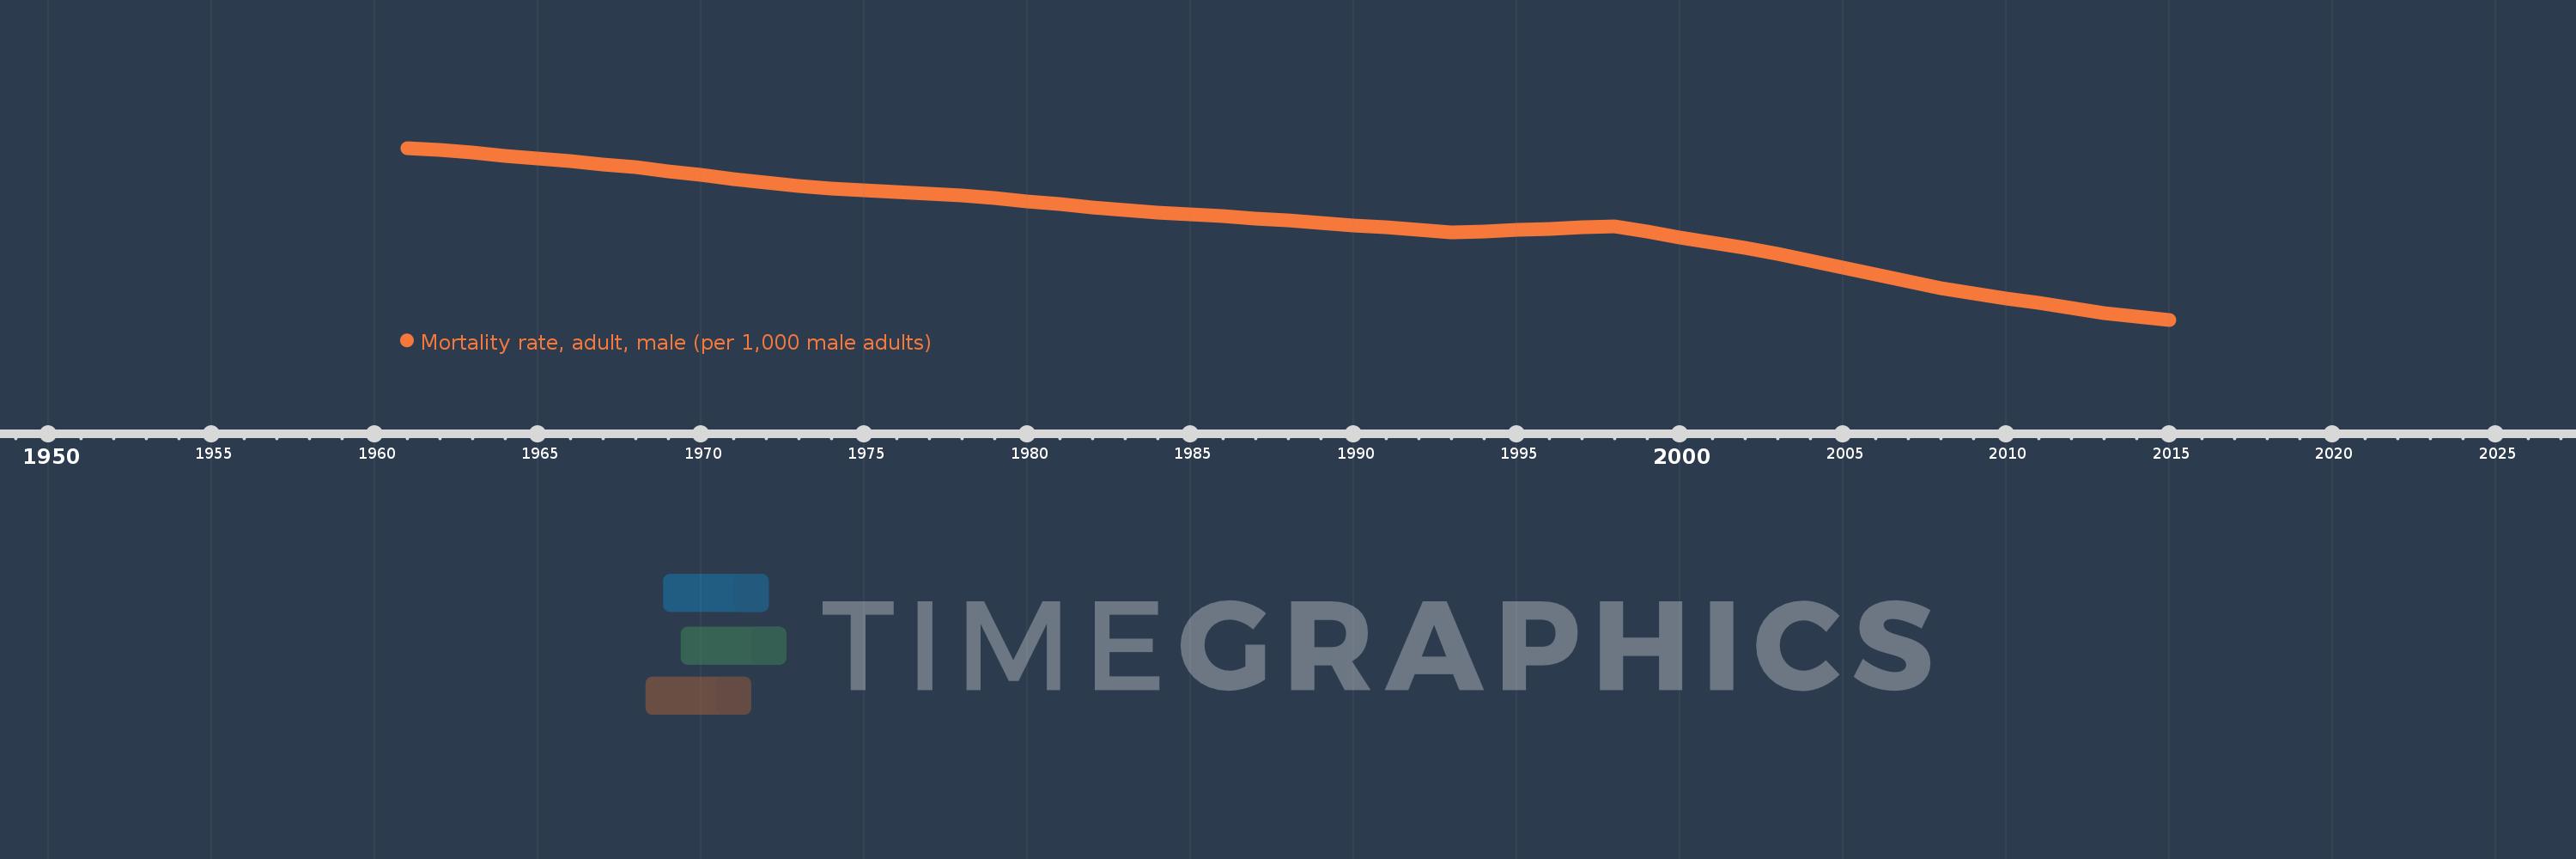
Mortality rate, adult, male (per 1,000 male adults)
2015,2014,2013,2012,2011,2010,2009,2008,2007,2006,2005,2004,2003,2002,2001,2000,1999,1998,1997,1996,1995,1994,1993,1992,1991,1990,1989,1988,1987,1986,1985,1984,1983,1982,1981,1980,1979,1978,1977,1976,1975,1974,1973,1972,1971,1970,1969,1968,1967,1966,1965,1964,1963,1962,1961
This statistics in other country:
AfghanistanAlbaniaAlgeriaAngolaAntigua and BarbudaArab WorldArgentinaArmeniaArubaAustraliaAustriaAzerbaijanBahamas, TheBahrainBangladeshBarbadosBelarusBelgiumBelizeBeninBhutanBoliviaBosnia and HerzegovinaBotswanaBrazilBrunei DarussalamBulgariaBurkina FasoBurundiCabo VerdeCambodiaCameroonCanadaCaribbean small statesCentral African RepublicCentral Europe and the BalticsChadChannel IslandsChileChinaColombiaComorosCongo, Dem. Rep.Congo, Rep.Costa RicaCote d'IvoireCroatiaCubaCuracaoCyprusCzech RepublicDenmarkDjiboutiDominicaDominican RepublicEarly-demographic dividendEast Asia & PacificEast Asia & Pacific (excluding high income)East Asia & Pacific (IDA & IBRD countries)EcuadorEgypt, Arab Rep.El SalvadorEquatorial GuineaEritreaEstoniaEthiopiaEuro areaEurope & Central AsiaEurope & Central Asia (excluding high income)Europe & Central Asia (IDA & IBRD countries)European UnionFijiFinlandFragile and conflict affected situationsFranceFrench PolynesiaGabonGambia, TheGeorgiaGermanyGhanaGreeceGreenlandGrenadaGuamGuatemalaGuineaGuinea-BissauGuyanaHaitiHeavily indebted poor countries (HIPC)High incomeHondurasHong Kong SAR, ChinaHungaryIBRD onlyIcelandIDA & IBRD totalIDA blendIDA onlyIDA totalIndiaIndonesiaIran, Islamic Rep.IraqIrelandIsraelItalyJamaicaJapanJordanKazakhstanKenyaKiribatiKorea, Dem. People’s Rep.Korea, Rep.KuwaitKyrgyz RepublicLao PDRLate-demographic dividendLatin America & Caribbean Latin America & Caribbean (excluding high income)Latin America & the Caribbean (IDA & IBRD countries)LatviaLeast developed countries: UN classificationLebanonLesothoLiberiaLibyaLithuaniaLow & middle incomeLow incomeLower middle incomeLuxembourgMacao SAR, ChinaMacedonia, FYRMadagascarMalawiMalaysiaMaldivesMaliMaltaMarshall IslandsMauritaniaMauritiusMexicoMicronesia, Fed. Sts.Middle East & North AfricaMiddle East & North Africa (excluding high income)Middle East & North Africa (IDA & IBRD countries)Middle incomeMoldovaMongoliaMontenegroMoroccoMozambiqueMyanmarNamibiaNepalNetherlandsNew CaledoniaNew ZealandNicaraguaNigerNigeriaNorth AmericaNorwayOECD membersOmanOther small statesPacific island small statesPakistanPanamaPapua New GuineaParaguayPeruPhilippinesPolandPortugalPost-demographic dividendPre-demographic dividendPuerto RicoQatarRomaniaRussian FederationRwandaSamoaSao Tome and PrincipeSaudi ArabiaSenegalSerbiaSeychellesSierra LeoneSingaporeSlovak RepublicSloveniaSmall statesSolomon IslandsSomaliaSouth AfricaSouth AsiaSouth Asia (IDA & IBRD)South SudanSpainSri LankaSt. Kitts and NevisSt. LuciaSt. Vincent and the GrenadinesSub-Saharan Africa Sub-Saharan Africa (excluding high income)Sub-Saharan Africa (IDA & IBRD countries)SudanSurinameSwazilandSwedenSwitzerlandSyrian Arab RepublicTajikistanTanzaniaThailandTimor-LesteTogoTongaTrinidad and TobagoTunisiaTurkeyTurkmenistanUgandaUkraineUnited Arab EmiratesUnited KingdomUnited StatesUpper middle incomeUruguayUzbekistanVanuatuVenezuela, RBVietnamVirgin Islands (U.S.)West Bank and GazaWorldYemen, Rep.ZambiaZimbabwe Timeline:
This timeline shows a graph from 1961 to 2015 of Congo, Dem. Rep.. No data until 1960. Number of actual observations by date: 55.
Source name:
World Development Indicators
Source organization:
(1) United Nations Population Division. World Population Prospects. New York, United Nations, Department of Economic and Social Affairs (advanced Excel tables). Available at http://esa.un.org/wpp/unpp/panel_population.htm, (2) University of California, Berkeley, and Max Planck Institute for Demographic Research. Human Mortality Database. [ www.mortality.org or www.humanmortality.de].
Categories, topics:
Health, Gender
Last updated:
apr 23, 2017
Indicators value changes by year
Minimum:
289.696
jan 1, 2015
Maximum:
470.33
jan 1, 1961
At the date of observation
Value
Absolute change
Change from previous value
jan 1, 1961
470.33
+470.33
0.0%
jan 1, 1962
467.851
-2.479
-0.53%
jan 1, 1963
465.372
-2.479
-0.53%
jan 1, 1964
462.292
-3.08
-0.66%
jan 1, 1965
459.211
-3.081
-0.67%
jan 1, 1966
456.131
-3.08
-0.67%
jan 1, 1967
453.05
-3.081
-0.68%
jan 1, 1968
449.97
-3.08
-0.68%
jan 1, 1969
445.963
-4.007
-0.89%
jan 1, 1970
441.956
-4.007
-0.9%
jan 1, 1971
437.949
-4.007
-0.91%
jan 1, 1972
433.942
-4.007
-0.91%
jan 1, 1973
429.935
-4.007
-0.92%
jan 1, 1974
428.017
-1.918
-0.45%
jan 1, 1975
426.099
-1.918
-0.45%
jan 1, 1976
424.181
-1.918
-0.45%
jan 1, 1977
422.263
-1.918
-0.45%
jan 1, 1978
420.345
-1.918
-0.45%
jan 1, 1979
417.23
-3.115
-0.74%
jan 1, 1980
414.115
-3.115
-0.75%
jan 1, 1981
410.999
-3.116
-0.75%
jan 1, 1982
407.884
-3.115
-0.76%
jan 1, 1983
404.769
-3.115
-0.76%
jan 1, 1984
402.673
-2.096
-0.52%
jan 1, 1985
400.577
-2.096
-0.52%
jan 1, 1986
398.481
-2.096
-0.52%
jan 1, 1987
396.385
-2.096
-0.53%
jan 1, 1988
394.29
-2.095
-0.53%
jan 1, 1989
391.718
-2.572
-0.65%
jan 1, 1990
389.147
-2.571
-0.66%
jan 1, 1991
386.576
-2.571
-0.66%
jan 1, 1992
384.004
-2.572
-0.67%
jan 1, 1993
381.433
-2.571
-0.67%
jan 1, 1994
382.766
+1.333
0.35%
jan 1, 1995
384.1
+1.334
0.35%
jan 1, 1996
385.434
+1.334
0.35%
jan 1, 1997
386.767
+1.333
0.35%
jan 1, 1998
388.101
+1.334
0.34%
jan 1, 1999
382.336
-5.765
-1.49%
jan 1, 2000
376.57
-5.766
-1.51%
jan 1, 2001
370.805
-5.765
-1.53%
jan 1, 2002
365.04
-5.765
-1.55%
jan 1, 2003
359.275
-5.765
-1.58%
jan 1, 2004
352.01
-7.265
-2.02%
jan 1, 2005
344.745
-7.265
-2.06%
jan 1, 2006
337.48
-7.265
-2.11%
jan 1, 2007
330.215
-7.265
-2.15%
jan 1, 2008
322.95
-7.265
-2.2%
jan 1, 2009
317.671
-5.279
-1.63%
jan 1, 2010
312.391
-5.28
-1.66%
jan 1, 2011
307.112
-5.279
-1.69%
jan 1, 2012
301.832
-5.28
-1.72%
jan 1, 2013
296.552
-5.28
-1.75%
jan 1, 2014
293.124
-3.428
-1.16%
jan 1, 2015
289.696
-3.428
-1.17%
Ranking of countries by current statistics by years


Comments: