29
/
en
AIzaSyAYiBZKx7MnpbEhh9jyipgxe19OcubqV5w
April 1, 2024
284928
Yemen, Rep.
YEM
true
2
1
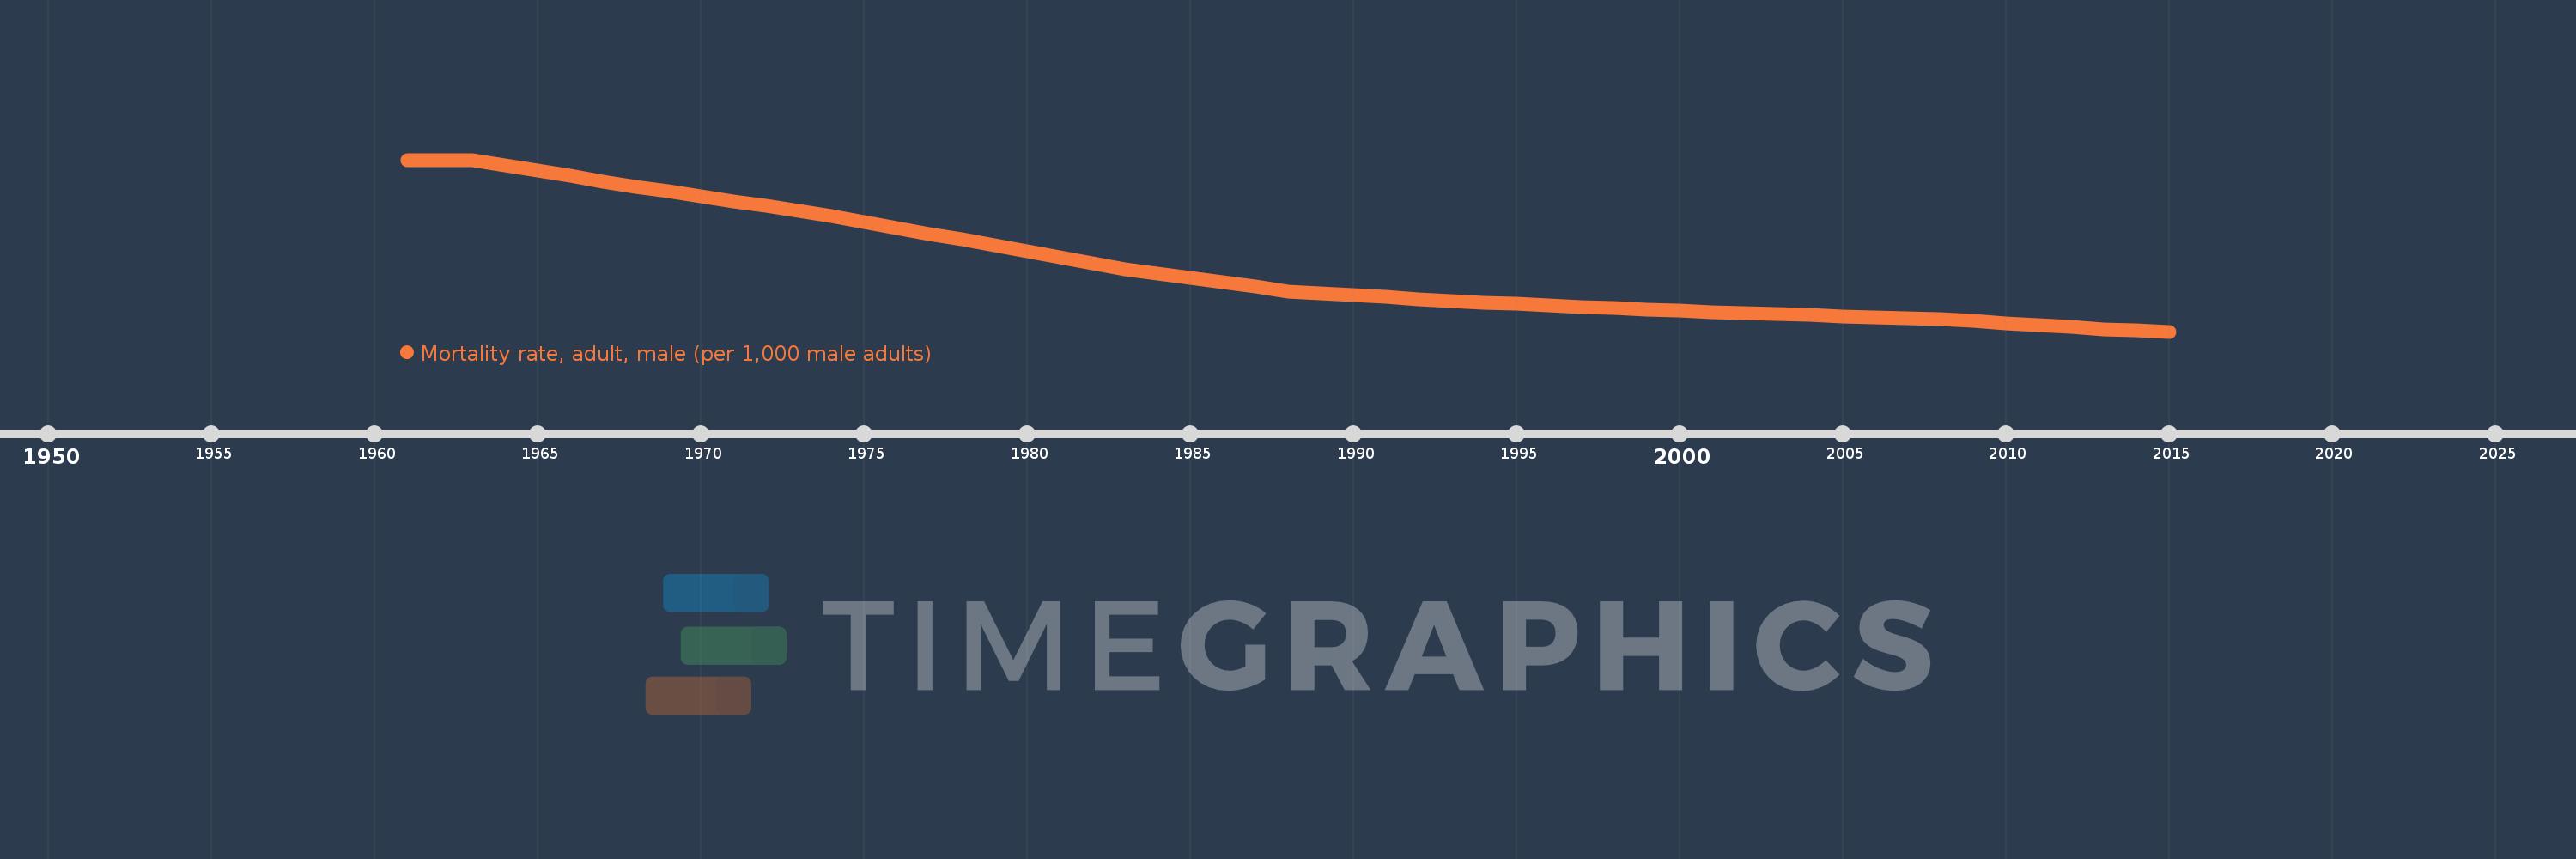
Mortality rate, adult, male (per 1,000 male adults)
2015,2014,2013,2012,2011,2010,2009,2008,2007,2006,2005,2004,2003,2002,2001,2000,1999,1998,1997,1996,1995,1994,1993,1992,1991,1990,1989,1988,1987,1986,1985,1984,1983,1982,1981,1980,1979,1978,1977,1976,1975,1974,1973,1972,1971,1970,1969,1968,1967,1966,1965,1964,1963,1962,1961
This statistics in other country:
AfghanistanAlbaniaAlgeriaAngolaAntigua and BarbudaArab WorldArgentinaArmeniaArubaAustraliaAustriaAzerbaijanBahamas, TheBahrainBangladeshBarbadosBelarusBelgiumBelizeBeninBhutanBoliviaBosnia and HerzegovinaBotswanaBrazilBrunei DarussalamBulgariaBurkina FasoBurundiCabo VerdeCambodiaCameroonCanadaCaribbean small statesCentral African RepublicCentral Europe and the BalticsChadChannel IslandsChileChinaColombiaComorosCongo, Dem. Rep.Congo, Rep.Costa RicaCote d'IvoireCroatiaCubaCuracaoCyprusCzech RepublicDenmarkDjiboutiDominicaDominican RepublicEarly-demographic dividendEast Asia & PacificEast Asia & Pacific (excluding high income)East Asia & Pacific (IDA & IBRD countries)EcuadorEgypt, Arab Rep.El SalvadorEquatorial GuineaEritreaEstoniaEthiopiaEuro areaEurope & Central AsiaEurope & Central Asia (excluding high income)Europe & Central Asia (IDA & IBRD countries)European UnionFijiFinlandFragile and conflict affected situationsFranceFrench PolynesiaGabonGambia, TheGeorgiaGermanyGhanaGreeceGreenlandGrenadaGuamGuatemalaGuineaGuinea-BissauGuyanaHaitiHeavily indebted poor countries (HIPC)High incomeHondurasHong Kong SAR, ChinaHungaryIBRD onlyIcelandIDA & IBRD totalIDA blendIDA onlyIDA totalIndiaIndonesiaIran, Islamic Rep.IraqIrelandIsraelItalyJamaicaJapanJordanKazakhstanKenyaKiribatiKorea, Dem. People’s Rep.Korea, Rep.KuwaitKyrgyz RepublicLao PDRLate-demographic dividendLatin America & Caribbean Latin America & Caribbean (excluding high income)Latin America & the Caribbean (IDA & IBRD countries)LatviaLeast developed countries: UN classificationLebanonLesothoLiberiaLibyaLithuaniaLow & middle incomeLow incomeLower middle incomeLuxembourgMacao SAR, ChinaMacedonia, FYRMadagascarMalawiMalaysiaMaldivesMaliMaltaMarshall IslandsMauritaniaMauritiusMexicoMicronesia, Fed. Sts.Middle East & North AfricaMiddle East & North Africa (excluding high income)Middle East & North Africa (IDA & IBRD countries)Middle incomeMoldovaMongoliaMontenegroMoroccoMozambiqueMyanmarNamibiaNepalNetherlandsNew CaledoniaNew ZealandNicaraguaNigerNigeriaNorth AmericaNorwayOECD membersOmanOther small statesPacific island small statesPakistanPanamaPapua New GuineaParaguayPeruPhilippinesPolandPortugalPost-demographic dividendPre-demographic dividendPuerto RicoQatarRomaniaRussian FederationRwandaSamoaSao Tome and PrincipeSaudi ArabiaSenegalSerbiaSeychellesSierra LeoneSingaporeSlovak RepublicSloveniaSmall statesSolomon IslandsSomaliaSouth AfricaSouth AsiaSouth Asia (IDA & IBRD)South SudanSpainSri LankaSt. Kitts and NevisSt. LuciaSt. Vincent and the GrenadinesSub-Saharan Africa Sub-Saharan Africa (excluding high income)Sub-Saharan Africa (IDA & IBRD countries)SudanSurinameSwazilandSwedenSwitzerlandSyrian Arab RepublicTajikistanTanzaniaThailandTimor-LesteTogoTongaTrinidad and TobagoTunisiaTurkeyTurkmenistanUgandaUkraineUnited Arab EmiratesUnited KingdomUnited StatesUpper middle incomeUruguayUzbekistanVanuatuVenezuela, RBVietnamVirgin Islands (U.S.)West Bank and GazaWorldYemen, Rep.ZambiaZimbabwe Timeline:
This timeline shows a graph from 1961 to 2015 of Yemen, Rep.. No data until 1960. Number of actual observations by date: 55.
Source name:
World Development Indicators
Source organization:
(1) United Nations Population Division. World Population Prospects. New York, United Nations, Department of Economic and Social Affairs (advanced Excel tables). Available at http://esa.un.org/wpp/unpp/panel_population.htm, (2) University of California, Berkeley, and Max Planck Institute for Demographic Research. Human Mortality Database. [ www.mortality.org or www.humanmortality.de].
Categories, topics:
Health, Gender
Last updated:
apr 23, 2017
Indicators value changes by year
Minimum:
245.432
jan 1, 2015
Maximum:
518.341
jan 1, 1961
At the date of observation
Value
Absolute change
Change from previous value
jan 1, 1961
518.341
+518.341
0.0%
jan 1, 1962
518.341
0.0
0.0%
jan 1, 1963
518.341
0.0
0.0%
jan 1, 1964
509.811
-8.53
-1.65%
jan 1, 1965
501.281
-8.53
-1.67%
jan 1, 1966
492.751
-8.53
-1.7%
jan 1, 1967
484.221
-8.53
-1.73%
jan 1, 1968
475.691
-8.53
-1.76%
jan 1, 1969
468.074
-7.617
-1.6%
jan 1, 1970
460.458
-7.616
-1.63%
jan 1, 1971
452.841
-7.617
-1.65%
jan 1, 1972
445.224
-7.617
-1.68%
jan 1, 1973
437.608
-7.616
-1.71%
jan 1, 1974
428.445
-9.163
-2.09%
jan 1, 1975
419.283
-9.162
-2.14%
jan 1, 1976
410.121
-9.162
-2.19%
jan 1, 1977
400.958
-9.163
-2.23%
jan 1, 1978
391.796
-9.162
-2.29%
jan 1, 1979
382.374
-9.422
-2.4%
jan 1, 1980
372.952
-9.422
-2.46%
jan 1, 1981
363.53
-9.422
-2.53%
jan 1, 1982
354.108
-9.422
-2.59%
jan 1, 1983
344.686
-9.422
-2.66%
jan 1, 1984
337.641
-7.045
-2.04%
jan 1, 1985
330.596
-7.045
-2.09%
jan 1, 1986
323.552
-7.044
-2.13%
jan 1, 1987
316.507
-7.045
-2.18%
jan 1, 1988
309.463
-7.044
-2.23%
jan 1, 1989
306.315
-3.148
-1.02%
jan 1, 1990
303.167
-3.148
-1.03%
jan 1, 1991
300.019
-3.148
-1.04%
jan 1, 1992
296.871
-3.148
-1.05%
jan 1, 1993
293.723
-3.148
-1.06%
jan 1, 1994
291.461
-2.262
-0.77%
jan 1, 1995
289.199
-2.262
-0.78%
jan 1, 1996
286.937
-2.262
-0.78%
jan 1, 1997
284.675
-2.262
-0.79%
jan 1, 1998
282.413
-2.262
-0.79%
jan 1, 1999
280.527
-1.886
-0.67%
jan 1, 2000
278.641
-1.886
-0.67%
jan 1, 2001
276.754
-1.887
-0.68%
jan 1, 2002
274.868
-1.886
-0.68%
jan 1, 2003
272.982
-1.886
-0.69%
jan 1, 2004
271.376
-1.606
-0.59%
jan 1, 2005
269.771
-1.605
-0.59%
jan 1, 2006
268.165
-1.606
-0.6%
jan 1, 2007
266.559
-1.606
-0.6%
jan 1, 2008
264.953
-1.606
-0.6%
jan 1, 2009
261.852
-3.101
-1.17%
jan 1, 2010
258.751
-3.101
-1.18%
jan 1, 2011
255.65
-3.101
-1.2%
jan 1, 2012
252.549
-3.101
-1.21%
jan 1, 2013
249.448
-3.101
-1.23%
jan 1, 2014
247.44
-2.008
-0.8%
jan 1, 2015
245.432
-2.008
-0.81%
Ranking of countries by current statistics by years


Comments: