29
/
en
AIzaSyAYiBZKx7MnpbEhh9jyipgxe19OcubqV5w
April 1, 2024
152817
Hungary
HUN
true
2
1
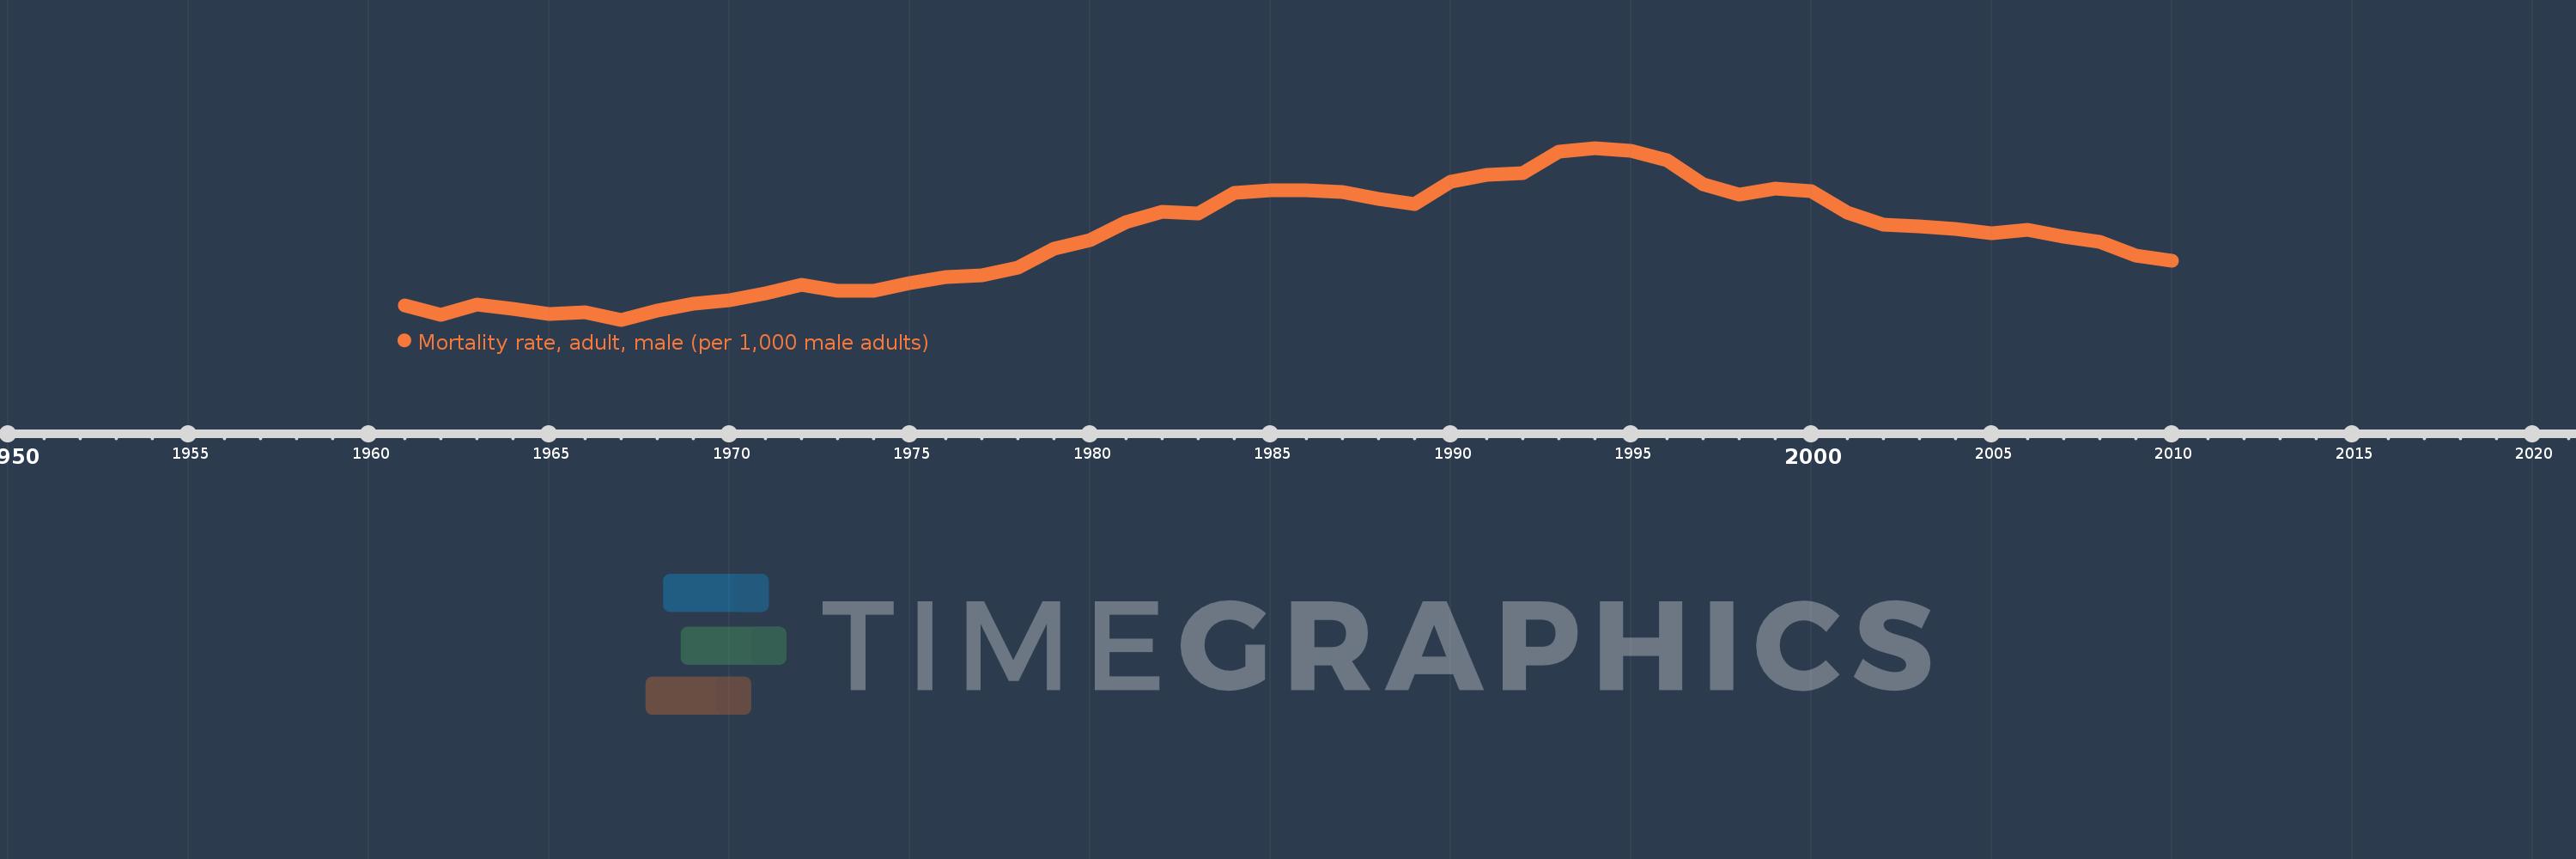
Mortality rate, adult, male (per 1,000 male adults)
2010,2009,2008,2007,2006,2005,2004,2003,2002,2001,2000,1999,1998,1997,1996,1995,1994,1993,1992,1991,1990,1989,1988,1987,1986,1985,1984,1983,1982,1981,1980,1979,1978,1977,1976,1975,1974,1973,1972,1971,1970,1969,1968,1967,1966,1965,1964,1963,1962,1961
This statistics in other country:
AfghanistanAlbaniaAlgeriaAngolaAntigua and BarbudaArab WorldArgentinaArmeniaArubaAustraliaAustriaAzerbaijanBahamas, TheBahrainBangladeshBarbadosBelarusBelgiumBelizeBeninBhutanBoliviaBosnia and HerzegovinaBotswanaBrazilBrunei DarussalamBulgariaBurkina FasoBurundiCabo VerdeCambodiaCameroonCanadaCaribbean small statesCentral African RepublicCentral Europe and the BalticsChadChannel IslandsChileChinaColombiaComorosCongo, Dem. Rep.Congo, Rep.Costa RicaCote d'IvoireCroatiaCubaCuracaoCyprusCzech RepublicDenmarkDjiboutiDominicaDominican RepublicEarly-demographic dividendEast Asia & PacificEast Asia & Pacific (excluding high income)East Asia & Pacific (IDA & IBRD countries)EcuadorEgypt, Arab Rep.El SalvadorEquatorial GuineaEritreaEstoniaEthiopiaEuro areaEurope & Central AsiaEurope & Central Asia (excluding high income)Europe & Central Asia (IDA & IBRD countries)European UnionFijiFinlandFragile and conflict affected situationsFranceFrench PolynesiaGabonGambia, TheGeorgiaGermanyGhanaGreeceGreenlandGrenadaGuamGuatemalaGuineaGuinea-BissauGuyanaHaitiHeavily indebted poor countries (HIPC)High incomeHondurasHong Kong SAR, ChinaHungaryIBRD onlyIcelandIDA & IBRD totalIDA blendIDA onlyIDA totalIndiaIndonesiaIran, Islamic Rep.IraqIrelandIsraelItalyJamaicaJapanJordanKazakhstanKenyaKiribatiKorea, Dem. People’s Rep.Korea, Rep.KuwaitKyrgyz RepublicLao PDRLate-demographic dividendLatin America & Caribbean Latin America & Caribbean (excluding high income)Latin America & the Caribbean (IDA & IBRD countries)LatviaLeast developed countries: UN classificationLebanonLesothoLiberiaLibyaLithuaniaLow & middle incomeLow incomeLower middle incomeLuxembourgMacao SAR, ChinaMacedonia, FYRMadagascarMalawiMalaysiaMaldivesMaliMaltaMarshall IslandsMauritaniaMauritiusMexicoMicronesia, Fed. Sts.Middle East & North AfricaMiddle East & North Africa (excluding high income)Middle East & North Africa (IDA & IBRD countries)Middle incomeMoldovaMongoliaMontenegroMoroccoMozambiqueMyanmarNamibiaNepalNetherlandsNew CaledoniaNew ZealandNicaraguaNigerNigeriaNorth AmericaNorwayOECD membersOmanOther small statesPacific island small statesPakistanPanamaPapua New GuineaParaguayPeruPhilippinesPolandPortugalPost-demographic dividendPre-demographic dividendPuerto RicoQatarRomaniaRussian FederationRwandaSamoaSao Tome and PrincipeSaudi ArabiaSenegalSerbiaSeychellesSierra LeoneSingaporeSlovak RepublicSloveniaSmall statesSolomon IslandsSomaliaSouth AfricaSouth AsiaSouth Asia (IDA & IBRD)South SudanSpainSri LankaSt. Kitts and NevisSt. LuciaSt. Vincent and the GrenadinesSub-Saharan Africa Sub-Saharan Africa (excluding high income)Sub-Saharan Africa (IDA & IBRD countries)SudanSurinameSwazilandSwedenSwitzerlandSyrian Arab RepublicTajikistanTanzaniaThailandTimor-LesteTogoTongaTrinidad and TobagoTunisiaTurkeyTurkmenistanUgandaUkraineUnited Arab EmiratesUnited KingdomUnited StatesUpper middle incomeUruguayUzbekistanVanuatuVenezuela, RBVietnamVirgin Islands (U.S.)West Bank and GazaWorldYemen, Rep.ZambiaZimbabwe Timeline:
This timeline shows a graph from 1961 to 2010 of Hungary. No data until 1960. Number of actual observations by date: 50.
Source name:
World Development Indicators
Source organization:
(1) United Nations Population Division. World Population Prospects. New York, United Nations, Department of Economic and Social Affairs (advanced Excel tables). Available at http://esa.un.org/wpp/unpp/panel_population.htm, (2) University of California, Berkeley, and Max Planck Institute for Demographic Research. Human Mortality Database. [ www.mortality.org or www.humanmortality.de].
Categories, topics:
Health, Gender
Last updated:
apr 23, 2017
Indicators value changes by year
Minimum:
176.354
jan 1, 1967
Maximum:
328.702
jan 1, 1994
At the date of observation
Value
Absolute change
Change from previous value
jan 1, 1961
188.831
+188.831
0.0%
jan 1, 1962
180.848
-7.983
-4.23%
jan 1, 1963
189.921
+9.073
5.02%
jan 1, 1964
186.212
-3.709
-1.95%
jan 1, 1965
181.448
-4.764
-2.56%
jan 1, 1966
182.62
+1.172
0.65%
jan 1, 1967
176.354
-6.266
-3.43%
jan 1, 1968
184.686
+8.332
4.72%
jan 1, 1969
190.736
+6.05
3.28%
jan 1, 1970
193.388
+2.652
1.39%
jan 1, 1971
199.407
+6.019
3.11%
jan 1, 1972
207.129
+7.722
3.87%
jan 1, 1973
202.022
-5.107
-2.47%
jan 1, 1974
202.126
+0.104
0.05%
jan 1, 1975
208.95
+6.824
3.38%
jan 1, 1976
213.872
+4.922
2.36%
jan 1, 1977
215.938
+2.066
0.97%
jan 1, 1978
222.516
+6.578
3.05%
jan 1, 1979
239.479
+16.963
7.62%
jan 1, 1980
246.633
+7.154
2.99%
jan 1, 1981
263.237
+16.604
6.73%
jan 1, 1982
271.791
+8.554
3.25%
jan 1, 1983
270.444
-1.347
-0.5%
jan 1, 1984
288.806
+18.362
6.79%
jan 1, 1985
291.378
+2.572
0.89%
jan 1, 1986
291.421
+0.043
0.01%
jan 1, 1987
289.998
-1.423
-0.49%
jan 1, 1988
283.425
-6.573
-2.27%
jan 1, 1989
278.631
-4.794
-1.69%
jan 1, 1990
298.839
+20.208
7.25%
jan 1, 1991
305.114
+6.275
2.1%
jan 1, 1992
306.556
+1.442
0.47%
jan 1, 1993
325.131
+18.575
6.06%
jan 1, 1994
328.702
+3.571
1.1%
jan 1, 1995
326.534
-2.168
-0.66%
jan 1, 1996
317.966
-8.568
-2.62%
jan 1, 1997
296.428
-21.538
-6.77%
jan 1, 1998
287.562
-8.866
-2.99%
jan 1, 1999
292.859
+5.297
1.84%
jan 1, 2000
290.148
-2.711
-0.93%
jan 1, 2001
271.521
-18.627
-6.42%
jan 1, 2002
260.692
-10.829
-3.99%
jan 1, 2003
259.13
-1.562
-0.6%
jan 1, 2004
257.163
-1.967
-0.76%
jan 1, 2005
252.908
-4.255
-1.65%
jan 1, 2006
256.464
+3.556
1.41%
jan 1, 2007
250.03
-6.434
-2.51%
jan 1, 2008
245.779
-4.251
-1.7%
jan 1, 2009
233.23
-12.549
-5.11%
jan 1, 2010
228.637
-4.593
-1.97%
Ranking of countries by current statistics by years


Comments: