29
/
en
AIzaSyAYiBZKx7MnpbEhh9jyipgxe19OcubqV5w
April 1, 2024
77387
Bahrain
BHR
true
2
1
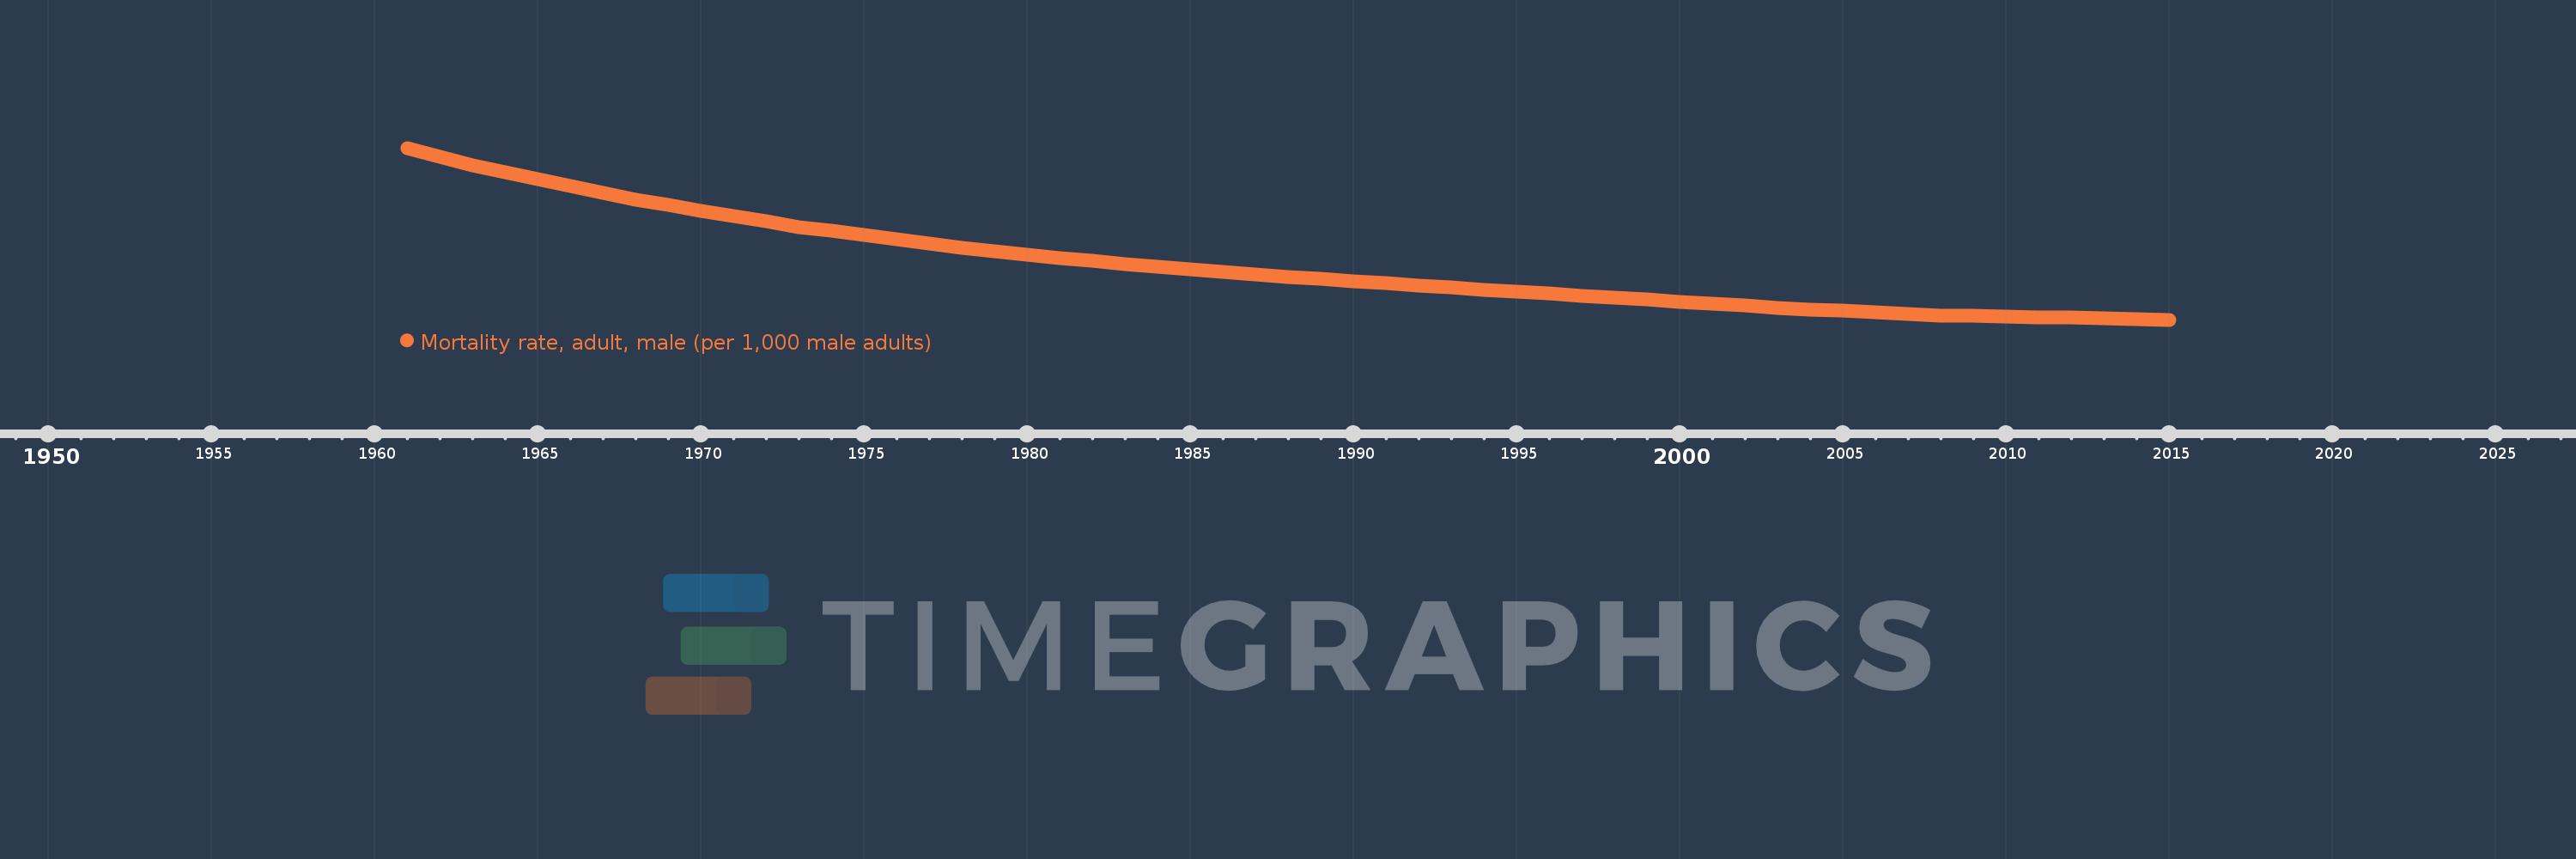
Mortality rate, adult, male (per 1,000 male adults)
2015,2014,2013,2012,2011,2010,2009,2008,2007,2006,2005,2004,2003,2002,2001,2000,1999,1998,1997,1996,1995,1994,1993,1992,1991,1990,1989,1988,1987,1986,1985,1984,1983,1982,1981,1980,1979,1978,1977,1976,1975,1974,1973,1972,1971,1970,1969,1968,1967,1966,1965,1964,1963,1962,1961
This statistics in other country:
AfghanistanAlbaniaAlgeriaAngolaAntigua and BarbudaArab WorldArgentinaArmeniaArubaAustraliaAustriaAzerbaijanBahamas, TheBahrainBangladeshBarbadosBelarusBelgiumBelizeBeninBhutanBoliviaBosnia and HerzegovinaBotswanaBrazilBrunei DarussalamBulgariaBurkina FasoBurundiCabo VerdeCambodiaCameroonCanadaCaribbean small statesCentral African RepublicCentral Europe and the BalticsChadChannel IslandsChileChinaColombiaComorosCongo, Dem. Rep.Congo, Rep.Costa RicaCote d'IvoireCroatiaCubaCuracaoCyprusCzech RepublicDenmarkDjiboutiDominicaDominican RepublicEarly-demographic dividendEast Asia & PacificEast Asia & Pacific (excluding high income)East Asia & Pacific (IDA & IBRD countries)EcuadorEgypt, Arab Rep.El SalvadorEquatorial GuineaEritreaEstoniaEthiopiaEuro areaEurope & Central AsiaEurope & Central Asia (excluding high income)Europe & Central Asia (IDA & IBRD countries)European UnionFijiFinlandFragile and conflict affected situationsFranceFrench PolynesiaGabonGambia, TheGeorgiaGermanyGhanaGreeceGreenlandGrenadaGuamGuatemalaGuineaGuinea-BissauGuyanaHaitiHeavily indebted poor countries (HIPC)High incomeHondurasHong Kong SAR, ChinaHungaryIBRD onlyIcelandIDA & IBRD totalIDA blendIDA onlyIDA totalIndiaIndonesiaIran, Islamic Rep.IraqIrelandIsraelItalyJamaicaJapanJordanKazakhstanKenyaKiribatiKorea, Dem. People’s Rep.Korea, Rep.KuwaitKyrgyz RepublicLao PDRLate-demographic dividendLatin America & Caribbean Latin America & Caribbean (excluding high income)Latin America & the Caribbean (IDA & IBRD countries)LatviaLeast developed countries: UN classificationLebanonLesothoLiberiaLibyaLithuaniaLow & middle incomeLow incomeLower middle incomeLuxembourgMacao SAR, ChinaMacedonia, FYRMadagascarMalawiMalaysiaMaldivesMaliMaltaMarshall IslandsMauritaniaMauritiusMexicoMicronesia, Fed. Sts.Middle East & North AfricaMiddle East & North Africa (excluding high income)Middle East & North Africa (IDA & IBRD countries)Middle incomeMoldovaMongoliaMontenegroMoroccoMozambiqueMyanmarNamibiaNepalNetherlandsNew CaledoniaNew ZealandNicaraguaNigerNigeriaNorth AmericaNorwayOECD membersOmanOther small statesPacific island small statesPakistanPanamaPapua New GuineaParaguayPeruPhilippinesPolandPortugalPost-demographic dividendPre-demographic dividendPuerto RicoQatarRomaniaRussian FederationRwandaSamoaSao Tome and PrincipeSaudi ArabiaSenegalSerbiaSeychellesSierra LeoneSingaporeSlovak RepublicSloveniaSmall statesSolomon IslandsSomaliaSouth AfricaSouth AsiaSouth Asia (IDA & IBRD)South SudanSpainSri LankaSt. Kitts and NevisSt. LuciaSt. Vincent and the GrenadinesSub-Saharan Africa Sub-Saharan Africa (excluding high income)Sub-Saharan Africa (IDA & IBRD countries)SudanSurinameSwazilandSwedenSwitzerlandSyrian Arab RepublicTajikistanTanzaniaThailandTimor-LesteTogoTongaTrinidad and TobagoTunisiaTurkeyTurkmenistanUgandaUkraineUnited Arab EmiratesUnited KingdomUnited StatesUpper middle incomeUruguayUzbekistanVanuatuVenezuela, RBVietnamVirgin Islands (U.S.)West Bank and GazaWorldYemen, Rep.ZambiaZimbabwe Timeline:
This timeline shows a graph from 1961 to 2015 of Bahrain. No data until 1960. Number of actual observations by date: 55.
Source name:
World Development Indicators
Source organization:
(1) United Nations Population Division. World Population Prospects. New York, United Nations, Department of Economic and Social Affairs (advanced Excel tables). Available at http://esa.un.org/wpp/unpp/panel_population.htm, (2) University of California, Berkeley, and Max Planck Institute for Demographic Research. Human Mortality Database. [ www.mortality.org or www.humanmortality.de].
Categories, topics:
Health, Gender
Last updated:
apr 23, 2017
Indicators value changes by year
Minimum:
75.454
jan 1, 2015
Maximum:
325.037
jan 1, 1961
At the date of observation
Value
Absolute change
Change from previous value
jan 1, 1961
325.037
+325.037
0.0%
jan 1, 1962
312.423
-12.614
-3.88%
jan 1, 1963
299.809
-12.614
-4.04%
jan 1, 1964
289.795
-10.014
-3.34%
jan 1, 1965
279.781
-10.014
-3.46%
jan 1, 1966
269.767
-10.014
-3.58%
jan 1, 1967
259.754
-10.013
-3.71%
jan 1, 1968
249.74
-10.014
-3.86%
jan 1, 1969
241.882
-7.858
-3.15%
jan 1, 1970
234.024
-7.858
-3.25%
jan 1, 1971
226.166
-7.858
-3.36%
jan 1, 1972
218.308
-7.858
-3.47%
jan 1, 1973
210.45
-7.858
-3.6%
jan 1, 1974
204.312
-6.138
-2.92%
jan 1, 1975
198.173
-6.139
-3.0%
jan 1, 1976
192.034
-6.139
-3.1%
jan 1, 1977
185.895
-6.139
-3.2%
jan 1, 1978
179.757
-6.138
-3.3%
jan 1, 1979
174.993
-4.764
-2.65%
jan 1, 1980
170.23
-4.763
-2.72%
jan 1, 1981
165.466
-4.764
-2.8%
jan 1, 1982
160.703
-4.763
-2.88%
jan 1, 1983
155.939
-4.764
-2.96%
jan 1, 1984
152.242
-3.697
-2.37%
jan 1, 1985
148.545
-3.697
-2.43%
jan 1, 1986
144.848
-3.697
-2.49%
jan 1, 1987
141.151
-3.697
-2.55%
jan 1, 1988
137.453
-3.698
-2.62%
jan 1, 1989
134.376
-3.077
-2.24%
jan 1, 1990
131.299
-3.077
-2.29%
jan 1, 1991
128.221
-3.078
-2.34%
jan 1, 1992
125.144
-3.077
-2.4%
jan 1, 1993
122.066
-3.078
-2.46%
jan 1, 1994
119.172
-2.894
-2.37%
jan 1, 1995
116.278
-2.894
-2.43%
jan 1, 1996
113.384
-2.894
-2.49%
jan 1, 1997
110.49
-2.894
-2.55%
jan 1, 1998
107.596
-2.894
-2.62%
jan 1, 1999
104.639
-2.957
-2.75%
jan 1, 2000
101.682
-2.957
-2.83%
jan 1, 2001
98.726
-2.956
-2.91%
jan 1, 2002
95.769
-2.957
-3.0%
jan 1, 2003
92.812
-2.957
-3.09%
jan 1, 2004
90.633
-2.179
-2.35%
jan 1, 2005
88.455
-2.178
-2.4%
jan 1, 2006
86.276
-2.179
-2.46%
jan 1, 2007
84.097
-2.179
-2.53%
jan 1, 2008
81.919
-2.178
-2.59%
jan 1, 2009
81.023
-0.896
-1.09%
jan 1, 2010
80.127
-0.896
-1.11%
jan 1, 2011
79.231
-0.896
-1.12%
jan 1, 2012
78.336
-0.895
-1.13%
jan 1, 2013
77.44
-0.896
-1.14%
jan 1, 2014
76.447
-0.993
-1.28%
jan 1, 2015
75.454
-0.993
-1.3%
Ranking of countries by current statistics by years


Comments: