29
/
en
AIzaSyAYiBZKx7MnpbEhh9jyipgxe19OcubqV5w
April 1, 2024
46341
Low income
LIC
false
2
1
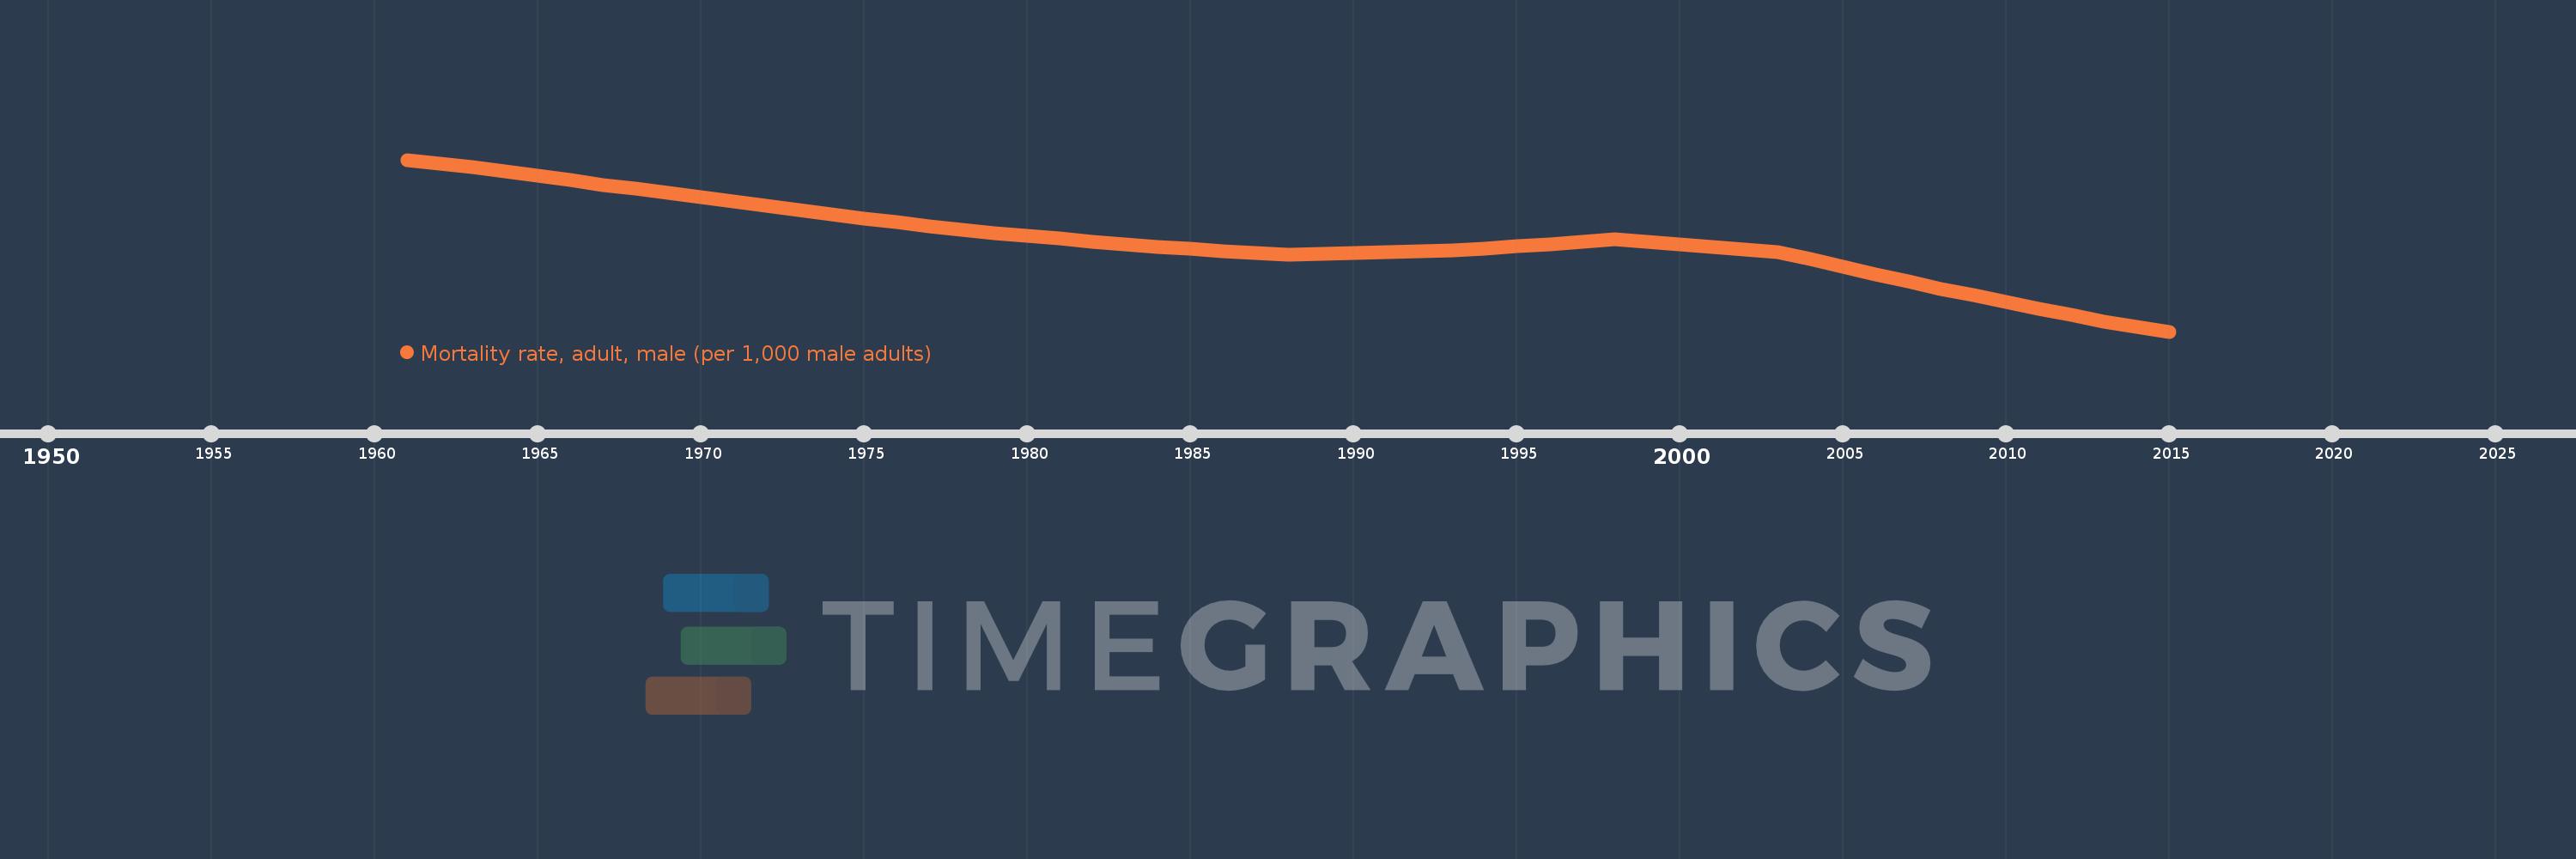
Mortality rate, adult, male (per 1,000 male adults)
2015,2014,2013,2012,2011,2010,2009,2008,2007,2006,2005,2004,2003,2002,2001,2000,1999,1998,1997,1996,1995,1994,1993,1992,1991,1990,1989,1988,1987,1986,1985,1984,1983,1982,1981,1980,1979,1978,1977,1976,1975,1974,1973,1972,1971,1970,1969,1968,1967,1966,1965,1964,1963,1962,1961
This statistics in other country:
AfghanistanAlbaniaAlgeriaAngolaAntigua and BarbudaArab WorldArgentinaArmeniaArubaAustraliaAustriaAzerbaijanBahamas, TheBahrainBangladeshBarbadosBelarusBelgiumBelizeBeninBhutanBoliviaBosnia and HerzegovinaBotswanaBrazilBrunei DarussalamBulgariaBurkina FasoBurundiCabo VerdeCambodiaCameroonCanadaCaribbean small statesCentral African RepublicCentral Europe and the BalticsChadChannel IslandsChileChinaColombiaComorosCongo, Dem. Rep.Congo, Rep.Costa RicaCote d'IvoireCroatiaCubaCuracaoCyprusCzech RepublicDenmarkDjiboutiDominicaDominican RepublicEarly-demographic dividendEast Asia & PacificEast Asia & Pacific (excluding high income)East Asia & Pacific (IDA & IBRD countries)EcuadorEgypt, Arab Rep.El SalvadorEquatorial GuineaEritreaEstoniaEthiopiaEuro areaEurope & Central AsiaEurope & Central Asia (excluding high income)Europe & Central Asia (IDA & IBRD countries)European UnionFijiFinlandFragile and conflict affected situationsFranceFrench PolynesiaGabonGambia, TheGeorgiaGermanyGhanaGreeceGreenlandGrenadaGuamGuatemalaGuineaGuinea-BissauGuyanaHaitiHeavily indebted poor countries (HIPC)High incomeHondurasHong Kong SAR, ChinaHungaryIBRD onlyIcelandIDA & IBRD totalIDA blendIDA onlyIDA totalIndiaIndonesiaIran, Islamic Rep.IraqIrelandIsraelItalyJamaicaJapanJordanKazakhstanKenyaKiribatiKorea, Dem. People’s Rep.Korea, Rep.KuwaitKyrgyz RepublicLao PDRLate-demographic dividendLatin America & Caribbean Latin America & Caribbean (excluding high income)Latin America & the Caribbean (IDA & IBRD countries)LatviaLeast developed countries: UN classificationLebanonLesothoLiberiaLibyaLithuaniaLow & middle incomeLow incomeLower middle incomeLuxembourgMacao SAR, ChinaMacedonia, FYRMadagascarMalawiMalaysiaMaldivesMaliMaltaMarshall IslandsMauritaniaMauritiusMexicoMicronesia, Fed. Sts.Middle East & North AfricaMiddle East & North Africa (excluding high income)Middle East & North Africa (IDA & IBRD countries)Middle incomeMoldovaMongoliaMontenegroMoroccoMozambiqueMyanmarNamibiaNepalNetherlandsNew CaledoniaNew ZealandNicaraguaNigerNigeriaNorth AmericaNorwayOECD membersOmanOther small statesPacific island small statesPakistanPanamaPapua New GuineaParaguayPeruPhilippinesPolandPortugalPost-demographic dividendPre-demographic dividendPuerto RicoQatarRomaniaRussian FederationRwandaSamoaSao Tome and PrincipeSaudi ArabiaSenegalSerbiaSeychellesSierra LeoneSingaporeSlovak RepublicSloveniaSmall statesSolomon IslandsSomaliaSouth AfricaSouth AsiaSouth Asia (IDA & IBRD)South SudanSpainSri LankaSt. Kitts and NevisSt. LuciaSt. Vincent and the GrenadinesSub-Saharan Africa Sub-Saharan Africa (excluding high income)Sub-Saharan Africa (IDA & IBRD countries)SudanSurinameSwazilandSwedenSwitzerlandSyrian Arab RepublicTajikistanTanzaniaThailandTimor-LesteTogoTongaTrinidad and TobagoTunisiaTurkeyTurkmenistanUgandaUkraineUnited Arab EmiratesUnited KingdomUnited StatesUpper middle incomeUruguayUzbekistanVanuatuVenezuela, RBVietnamVirgin Islands (U.S.)West Bank and GazaWorldYemen, Rep.ZambiaZimbabwe Timeline:
This timeline shows a graph from 1961 to 2015 of Low income. No data until 1960. Number of actual observations by date: 55.
Source name:
World Development Indicators
Source organization:
(1) United Nations Population Division. World Population Prospects. New York, United Nations, Department of Economic and Social Affairs (advanced Excel tables). Available at http://esa.un.org/wpp/unpp/panel_population.htm, (2) University of California, Berkeley, and Max Planck Institute for Demographic Research. Human Mortality Database. [ www.mortality.org or www.humanmortality.de].
Categories, topics:
Health, Gender
Last updated:
apr 23, 2017
Indicators value changes by year
Minimum:
283.753
jan 1, 2015
Maximum:
503.148
jan 1, 1961
At the date of observation
Value
Absolute change
Change from previous value
jan 1, 1961
503.148
+503.148
0.0%
jan 1, 1962
498.38
-4.768
-0.95%
jan 1, 1963
493.563
-4.817
-0.97%
jan 1, 1964
487.954
-5.609
-1.14%
jan 1, 1965
482.382
-5.572
-1.14%
jan 1, 1966
476.9
-5.482
-1.14%
jan 1, 1967
471.299
-5.601
-1.17%
jan 1, 1968
465.867
-5.432
-1.15%
jan 1, 1969
460.488
-5.379
-1.15%
jan 1, 1970
455.107
-5.382
-1.17%
jan 1, 1971
449.65
-5.457
-1.2%
jan 1, 1972
444.206
-5.444
-1.21%
jan 1, 1973
438.636
-5.57
-1.25%
jan 1, 1974
433.483
-5.153
-1.17%
jan 1, 1975
428.375
-5.108
-1.18%
jan 1, 1976
423.367
-5.007
-1.17%
jan 1, 1977
418.342
-5.025
-1.19%
jan 1, 1978
413.393
-4.95
-1.18%
jan 1, 1979
409.819
-3.573
-0.86%
jan 1, 1980
406.202
-3.617
-0.88%
jan 1, 1981
402.515
-3.687
-0.91%
jan 1, 1982
398.58
-3.935
-0.98%
jan 1, 1983
394.709
-3.872
-0.97%
jan 1, 1984
391.91
-2.799
-0.71%
jan 1, 1985
389.176
-2.733
-0.7%
jan 1, 1986
386.516
-2.661
-0.68%
jan 1, 1987
384.028
-2.488
-0.64%
jan 1, 1988
381.596
-2.431
-0.63%
jan 1, 1989
382.846
+1.25
0.33%
jan 1, 1990
384.248
+1.401
0.37%
jan 1, 1991
385.731
+1.483
0.39%
jan 1, 1992
386.792
+1.061
0.28%
jan 1, 1993
387.672
+0.88
0.23%
jan 1, 1994
390.127
+2.455
0.63%
jan 1, 1995
392.709
+2.582
0.66%
jan 1, 1996
395.444
+2.734
0.7%
jan 1, 1997
398.344
+2.9
0.73%
jan 1, 1998
401.338
+2.994
0.75%
jan 1, 1999
398.246
-3.092
-0.77%
jan 1, 2000
395.179
-3.067
-0.77%
jan 1, 2001
392.089
-3.091
-0.78%
jan 1, 2002
388.877
-3.212
-0.82%
jan 1, 2003
385.627
-3.25
-0.84%
jan 1, 2004
376.137
-9.49
-2.46%
jan 1, 2005
366.661
-9.476
-2.52%
jan 1, 2006
357.21
-9.451
-2.58%
jan 1, 2007
347.793
-9.417
-2.64%
jan 1, 2008
338.371
-9.422
-2.71%
jan 1, 2009
329.955
-8.416
-2.49%
jan 1, 2010
321.552
-8.403
-2.55%
jan 1, 2011
313.156
-8.396
-2.61%
jan 1, 2012
304.707
-8.448
-2.7%
jan 1, 2013
296.267
-8.441
-2.77%
jan 1, 2014
290.007
-6.26
-2.11%
jan 1, 2015
283.753
-6.254
-2.16%
Ranking of countries by current statistics by years


Comments: