29
/
en
AIzaSyAYiBZKx7MnpbEhh9jyipgxe19OcubqV5w
April 1, 2024
280059
Vanuatu
VUT
true
2
1
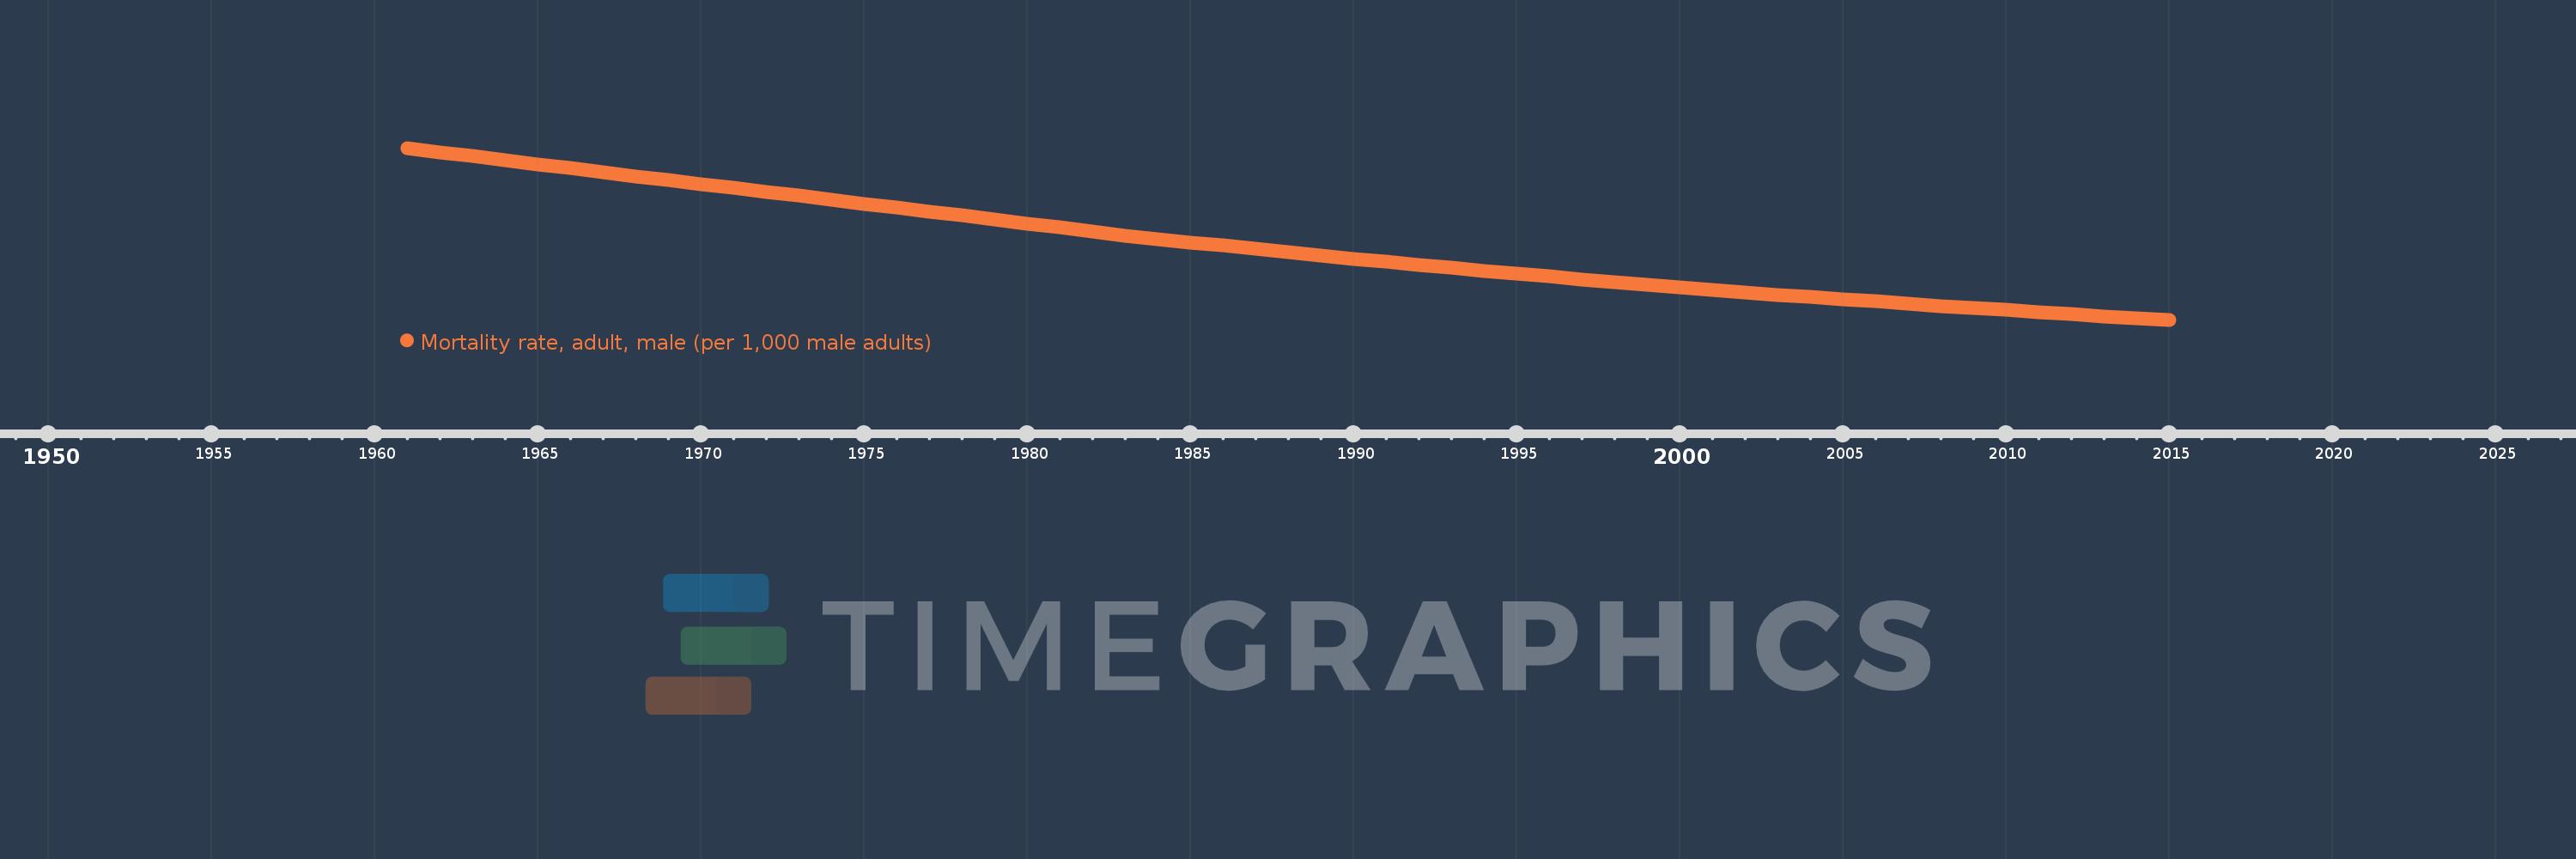
Mortality rate, adult, male (per 1,000 male adults)
2015,2014,2013,2012,2011,2010,2009,2008,2007,2006,2005,2004,2003,2002,2001,2000,1999,1998,1997,1996,1995,1994,1993,1992,1991,1990,1989,1988,1987,1986,1985,1984,1983,1982,1981,1980,1979,1978,1977,1976,1975,1974,1973,1972,1971,1970,1969,1968,1967,1966,1965,1964,1963,1962,1961
This statistics in other country:
AfghanistanAlbaniaAlgeriaAngolaAntigua and BarbudaArab WorldArgentinaArmeniaArubaAustraliaAustriaAzerbaijanBahamas, TheBahrainBangladeshBarbadosBelarusBelgiumBelizeBeninBhutanBoliviaBosnia and HerzegovinaBotswanaBrazilBrunei DarussalamBulgariaBurkina FasoBurundiCabo VerdeCambodiaCameroonCanadaCaribbean small statesCentral African RepublicCentral Europe and the BalticsChadChannel IslandsChileChinaColombiaComorosCongo, Dem. Rep.Congo, Rep.Costa RicaCote d'IvoireCroatiaCubaCuracaoCyprusCzech RepublicDenmarkDjiboutiDominicaDominican RepublicEarly-demographic dividendEast Asia & PacificEast Asia & Pacific (excluding high income)East Asia & Pacific (IDA & IBRD countries)EcuadorEgypt, Arab Rep.El SalvadorEquatorial GuineaEritreaEstoniaEthiopiaEuro areaEurope & Central AsiaEurope & Central Asia (excluding high income)Europe & Central Asia (IDA & IBRD countries)European UnionFijiFinlandFragile and conflict affected situationsFranceFrench PolynesiaGabonGambia, TheGeorgiaGermanyGhanaGreeceGreenlandGrenadaGuamGuatemalaGuineaGuinea-BissauGuyanaHaitiHeavily indebted poor countries (HIPC)High incomeHondurasHong Kong SAR, ChinaHungaryIBRD onlyIcelandIDA & IBRD totalIDA blendIDA onlyIDA totalIndiaIndonesiaIran, Islamic Rep.IraqIrelandIsraelItalyJamaicaJapanJordanKazakhstanKenyaKiribatiKorea, Dem. People’s Rep.Korea, Rep.KuwaitKyrgyz RepublicLao PDRLate-demographic dividendLatin America & Caribbean Latin America & Caribbean (excluding high income)Latin America & the Caribbean (IDA & IBRD countries)LatviaLeast developed countries: UN classificationLebanonLesothoLiberiaLibyaLithuaniaLow & middle incomeLow incomeLower middle incomeLuxembourgMacao SAR, ChinaMacedonia, FYRMadagascarMalawiMalaysiaMaldivesMaliMaltaMarshall IslandsMauritaniaMauritiusMexicoMicronesia, Fed. Sts.Middle East & North AfricaMiddle East & North Africa (excluding high income)Middle East & North Africa (IDA & IBRD countries)Middle incomeMoldovaMongoliaMontenegroMoroccoMozambiqueMyanmarNamibiaNepalNetherlandsNew CaledoniaNew ZealandNicaraguaNigerNigeriaNorth AmericaNorwayOECD membersOmanOther small statesPacific island small statesPakistanPanamaPapua New GuineaParaguayPeruPhilippinesPolandPortugalPost-demographic dividendPre-demographic dividendPuerto RicoQatarRomaniaRussian FederationRwandaSamoaSao Tome and PrincipeSaudi ArabiaSenegalSerbiaSeychellesSierra LeoneSingaporeSlovak RepublicSloveniaSmall statesSolomon IslandsSomaliaSouth AfricaSouth AsiaSouth Asia (IDA & IBRD)South SudanSpainSri LankaSt. Kitts and NevisSt. LuciaSt. Vincent and the GrenadinesSub-Saharan Africa Sub-Saharan Africa (excluding high income)Sub-Saharan Africa (IDA & IBRD countries)SudanSurinameSwazilandSwedenSwitzerlandSyrian Arab RepublicTajikistanTanzaniaThailandTimor-LesteTogoTongaTrinidad and TobagoTunisiaTurkeyTurkmenistanUgandaUkraineUnited Arab EmiratesUnited KingdomUnited StatesUpper middle incomeUruguayUzbekistanVanuatuVenezuela, RBVietnamVirgin Islands (U.S.)West Bank and GazaWorldYemen, Rep.ZambiaZimbabwe Timeline:
This timeline shows a graph from 1961 to 2015 of Vanuatu. No data until 1960. Number of actual observations by date: 55.
Source name:
World Development Indicators
Source organization:
(1) United Nations Population Division. World Population Prospects. New York, United Nations, Department of Economic and Social Affairs (advanced Excel tables). Available at http://esa.un.org/wpp/unpp/panel_population.htm, (2) University of California, Berkeley, and Max Planck Institute for Demographic Research. Human Mortality Database. [ www.mortality.org or www.humanmortality.de].
Categories, topics:
Health, Gender
Last updated:
apr 23, 2017
Indicators value changes by year
Minimum:
155.58
jan 1, 2015
Maximum:
438.398
jan 1, 1961
At the date of observation
Value
Absolute change
Change from previous value
jan 1, 1961
438.398
+438.398
0.0%
jan 1, 1962
431.484
-6.914
-1.58%
jan 1, 1963
424.57
-6.914
-1.6%
jan 1, 1964
418.022
-6.548
-1.54%
jan 1, 1965
411.473
-6.549
-1.57%
jan 1, 1966
404.924
-6.549
-1.59%
jan 1, 1967
398.376
-6.548
-1.62%
jan 1, 1968
391.827
-6.549
-1.64%
jan 1, 1969
385.41
-6.417
-1.64%
jan 1, 1970
378.994
-6.416
-1.66%
jan 1, 1971
372.577
-6.417
-1.69%
jan 1, 1972
366.161
-6.416
-1.72%
jan 1, 1973
359.744
-6.417
-1.75%
jan 1, 1974
353.226
-6.518
-1.81%
jan 1, 1975
346.708
-6.518
-1.85%
jan 1, 1976
340.19
-6.518
-1.88%
jan 1, 1977
333.671
-6.519
-1.92%
jan 1, 1978
327.153
-6.518
-1.95%
jan 1, 1979
320.529
-6.624
-2.02%
jan 1, 1980
313.905
-6.624
-2.07%
jan 1, 1981
307.281
-6.624
-2.11%
jan 1, 1982
300.657
-6.624
-2.16%
jan 1, 1983
294.033
-6.624
-2.2%
jan 1, 1984
288.515
-5.518
-1.88%
jan 1, 1985
282.996
-5.519
-1.91%
jan 1, 1986
277.477
-5.519
-1.95%
jan 1, 1987
271.958
-5.519
-1.99%
jan 1, 1988
266.44
-5.518
-2.03%
jan 1, 1989
261.298
-5.142
-1.93%
jan 1, 1990
256.155
-5.143
-1.97%
jan 1, 1991
251.013
-5.142
-2.01%
jan 1, 1992
245.871
-5.142
-2.05%
jan 1, 1993
240.729
-5.142
-2.09%
jan 1, 1994
236.077
-4.652
-1.93%
jan 1, 1995
231.425
-4.652
-1.97%
jan 1, 1996
226.774
-4.651
-2.01%
jan 1, 1997
222.122
-4.652
-2.05%
jan 1, 1998
217.47
-4.652
-2.09%
jan 1, 1999
213.276
-4.194
-1.93%
jan 1, 2000
209.082
-4.194
-1.97%
jan 1, 2001
204.887
-4.195
-2.01%
jan 1, 2002
200.693
-4.194
-2.05%
jan 1, 2003
196.499
-4.194
-2.09%
jan 1, 2004
192.885
-3.614
-1.84%
jan 1, 2005
189.271
-3.614
-1.87%
jan 1, 2006
185.657
-3.614
-1.91%
jan 1, 2007
182.043
-3.614
-1.95%
jan 1, 2008
178.429
-3.614
-1.99%
jan 1, 2009
174.937
-3.492
-1.96%
jan 1, 2010
171.444
-3.493
-2.0%
jan 1, 2011
167.951
-3.493
-2.04%
jan 1, 2012
164.459
-3.492
-2.08%
jan 1, 2013
160.966
-3.493
-2.12%
jan 1, 2014
158.273
-2.693
-1.67%
jan 1, 2015
155.58
-2.693
-1.7%
Ranking of countries by current statistics by years


Comments: