29
/
en
AIzaSyAYiBZKx7MnpbEhh9jyipgxe19OcubqV5w
April 1, 2024
138341
Georgia
GEO
true
2
1
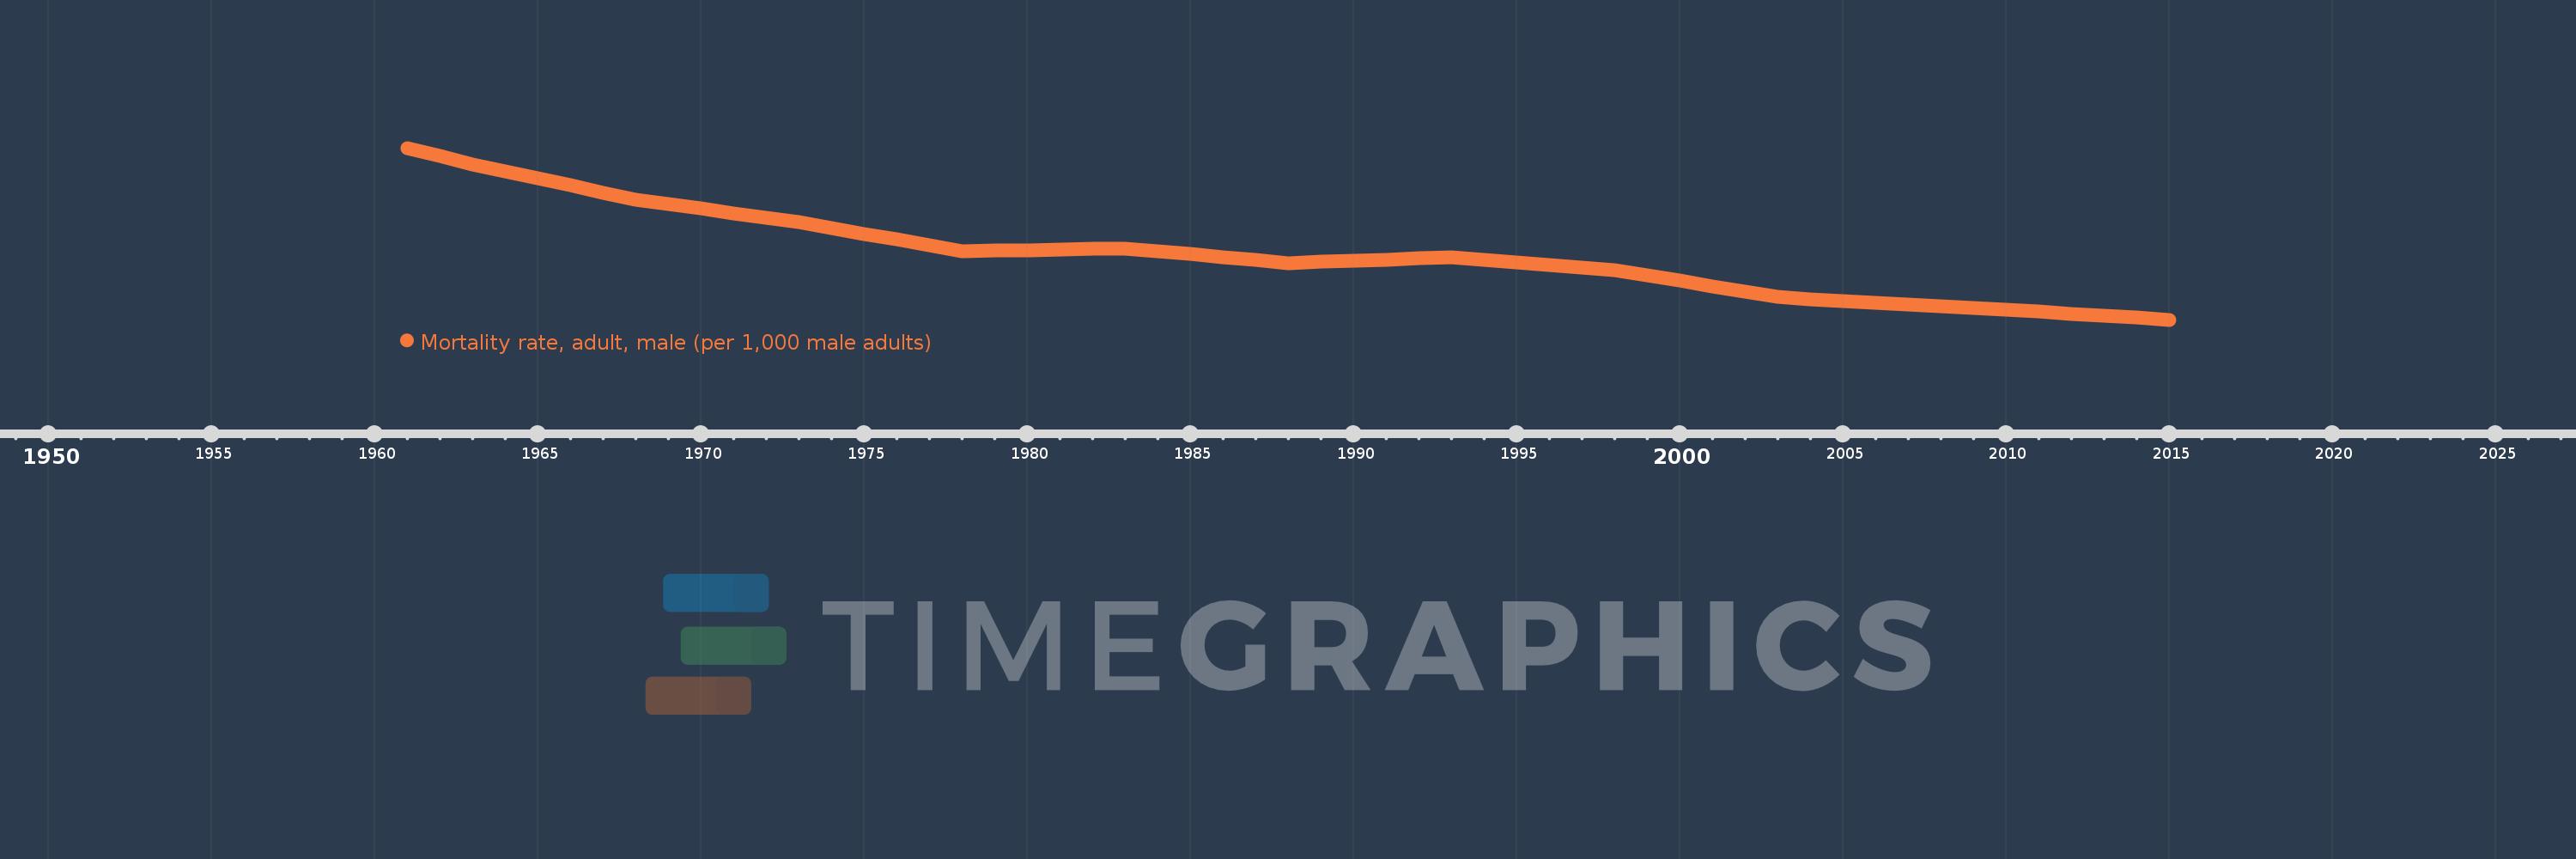
Mortality rate, adult, male (per 1,000 male adults)
2015,2014,2013,2012,2011,2010,2009,2008,2007,2006,2005,2004,2003,2002,2001,2000,1999,1998,1997,1996,1995,1994,1993,1992,1991,1990,1989,1988,1987,1986,1985,1984,1983,1982,1981,1980,1979,1978,1977,1976,1975,1974,1973,1972,1971,1970,1969,1968,1967,1966,1965,1964,1963,1962,1961
This statistics in other country:
AfghanistanAlbaniaAlgeriaAngolaAntigua and BarbudaArab WorldArgentinaArmeniaArubaAustraliaAustriaAzerbaijanBahamas, TheBahrainBangladeshBarbadosBelarusBelgiumBelizeBeninBhutanBoliviaBosnia and HerzegovinaBotswanaBrazilBrunei DarussalamBulgariaBurkina FasoBurundiCabo VerdeCambodiaCameroonCanadaCaribbean small statesCentral African RepublicCentral Europe and the BalticsChadChannel IslandsChileChinaColombiaComorosCongo, Dem. Rep.Congo, Rep.Costa RicaCote d'IvoireCroatiaCubaCuracaoCyprusCzech RepublicDenmarkDjiboutiDominicaDominican RepublicEarly-demographic dividendEast Asia & PacificEast Asia & Pacific (excluding high income)East Asia & Pacific (IDA & IBRD countries)EcuadorEgypt, Arab Rep.El SalvadorEquatorial GuineaEritreaEstoniaEthiopiaEuro areaEurope & Central AsiaEurope & Central Asia (excluding high income)Europe & Central Asia (IDA & IBRD countries)European UnionFijiFinlandFragile and conflict affected situationsFranceFrench PolynesiaGabonGambia, TheGeorgiaGermanyGhanaGreeceGreenlandGrenadaGuamGuatemalaGuineaGuinea-BissauGuyanaHaitiHeavily indebted poor countries (HIPC)High incomeHondurasHong Kong SAR, ChinaHungaryIBRD onlyIcelandIDA & IBRD totalIDA blendIDA onlyIDA totalIndiaIndonesiaIran, Islamic Rep.IraqIrelandIsraelItalyJamaicaJapanJordanKazakhstanKenyaKiribatiKorea, Dem. People’s Rep.Korea, Rep.KuwaitKyrgyz RepublicLao PDRLate-demographic dividendLatin America & Caribbean Latin America & Caribbean (excluding high income)Latin America & the Caribbean (IDA & IBRD countries)LatviaLeast developed countries: UN classificationLebanonLesothoLiberiaLibyaLithuaniaLow & middle incomeLow incomeLower middle incomeLuxembourgMacao SAR, ChinaMacedonia, FYRMadagascarMalawiMalaysiaMaldivesMaliMaltaMarshall IslandsMauritaniaMauritiusMexicoMicronesia, Fed. Sts.Middle East & North AfricaMiddle East & North Africa (excluding high income)Middle East & North Africa (IDA & IBRD countries)Middle incomeMoldovaMongoliaMontenegroMoroccoMozambiqueMyanmarNamibiaNepalNetherlandsNew CaledoniaNew ZealandNicaraguaNigerNigeriaNorth AmericaNorwayOECD membersOmanOther small statesPacific island small statesPakistanPanamaPapua New GuineaParaguayPeruPhilippinesPolandPortugalPost-demographic dividendPre-demographic dividendPuerto RicoQatarRomaniaRussian FederationRwandaSamoaSao Tome and PrincipeSaudi ArabiaSenegalSerbiaSeychellesSierra LeoneSingaporeSlovak RepublicSloveniaSmall statesSolomon IslandsSomaliaSouth AfricaSouth AsiaSouth Asia (IDA & IBRD)South SudanSpainSri LankaSt. Kitts and NevisSt. LuciaSt. Vincent and the GrenadinesSub-Saharan Africa Sub-Saharan Africa (excluding high income)Sub-Saharan Africa (IDA & IBRD countries)SudanSurinameSwazilandSwedenSwitzerlandSyrian Arab RepublicTajikistanTanzaniaThailandTimor-LesteTogoTongaTrinidad and TobagoTunisiaTurkeyTurkmenistanUgandaUkraineUnited Arab EmiratesUnited KingdomUnited StatesUpper middle incomeUruguayUzbekistanVanuatuVenezuela, RBVietnamVirgin Islands (U.S.)West Bank and GazaWorldYemen, Rep.ZambiaZimbabwe Timeline:
This timeline shows a graph from 1961 to 2015 of Georgia. No data until 1960. Number of actual observations by date: 55.
Source name:
World Development Indicators
Source organization:
(1) United Nations Population Division. World Population Prospects. New York, United Nations, Department of Economic and Social Affairs (advanced Excel tables). Available at http://esa.un.org/wpp/unpp/panel_population.htm, (2) University of California, Berkeley, and Max Planck Institute for Demographic Research. Human Mortality Database. [ www.mortality.org or www.humanmortality.de].
Categories, topics:
Health, Gender
Last updated:
apr 23, 2017
Indicators value changes by year
Minimum:
170.854
jan 1, 2015
Maximum:
305.978
jan 1, 1961
At the date of observation
Value
Absolute change
Change from previous value
jan 1, 1961
305.978
+305.978
0.0%
jan 1, 1962
299.578
-6.4
-2.09%
jan 1, 1963
293.178
-6.4
-2.14%
jan 1, 1964
287.607
-5.571
-1.9%
jan 1, 1965
282.036
-5.571
-1.94%
jan 1, 1966
276.465
-5.571
-1.98%
jan 1, 1967
270.894
-5.571
-2.02%
jan 1, 1968
265.323
-5.571
-2.06%
jan 1, 1969
261.752
-3.571
-1.35%
jan 1, 1970
258.18
-3.572
-1.36%
jan 1, 1971
254.609
-3.571
-1.38%
jan 1, 1972
251.038
-3.571
-1.4%
jan 1, 1973
247.466
-3.572
-1.42%
jan 1, 1974
242.944
-4.522
-1.83%
jan 1, 1975
238.421
-4.523
-1.86%
jan 1, 1976
233.899
-4.522
-1.9%
jan 1, 1977
229.377
-4.522
-1.93%
jan 1, 1978
224.854
-4.523
-1.97%
jan 1, 1979
225.28
+0.426
0.19%
jan 1, 1980
225.706
+0.426
0.19%
jan 1, 1981
226.132
+0.426
0.19%
jan 1, 1982
226.558
+0.426
0.19%
jan 1, 1983
226.984
+0.426
0.19%
jan 1, 1984
224.664
-2.32
-1.02%
jan 1, 1985
222.343
-2.321
-1.03%
jan 1, 1986
220.023
-2.32
-1.04%
jan 1, 1987
217.702
-2.321
-1.05%
jan 1, 1988
215.382
-2.32
-1.07%
jan 1, 1989
216.334
+0.952
0.44%
jan 1, 1990
217.285
+0.951
0.44%
jan 1, 1991
218.237
+0.952
0.44%
jan 1, 1992
219.189
+0.952
0.44%
jan 1, 1993
220.141
+0.952
0.43%
jan 1, 1994
218.131
-2.01
-0.91%
jan 1, 1995
216.122
-2.009
-0.92%
jan 1, 1996
214.112
-2.01
-0.93%
jan 1, 1997
212.103
-2.009
-0.94%
jan 1, 1998
210.094
-2.009
-0.95%
jan 1, 1999
205.8
-4.294
-2.04%
jan 1, 2000
201.506
-4.294
-2.09%
jan 1, 2001
197.213
-4.293
-2.13%
jan 1, 2002
192.919
-4.294
-2.18%
jan 1, 2003
188.625
-4.294
-2.23%
jan 1, 2004
187.163
-1.462
-0.78%
jan 1, 2005
185.7
-1.463
-0.78%
jan 1, 2006
184.237
-1.463
-0.79%
jan 1, 2007
182.775
-1.462
-0.79%
jan 1, 2008
181.312
-1.463
-0.8%
jan 1, 2009
179.904
-1.408
-0.78%
jan 1, 2010
178.497
-1.407
-0.78%
jan 1, 2011
177.089
-1.408
-0.79%
jan 1, 2012
175.681
-1.408
-0.8%
jan 1, 2013
174.273
-1.408
-0.8%
jan 1, 2014
172.564
-1.709
-0.98%
jan 1, 2015
170.854
-1.71
-0.99%
Ranking of countries by current statistics by years


Comments: